Parameterization in Calculated Columns
Given Table 1:
| Group | Name | Value |
|
X |
A |
2.00 |
|
X |
B |
3.00 |
|
Y |
C |
4.00 |
Creating a new numeric parameter X with a value of 7:
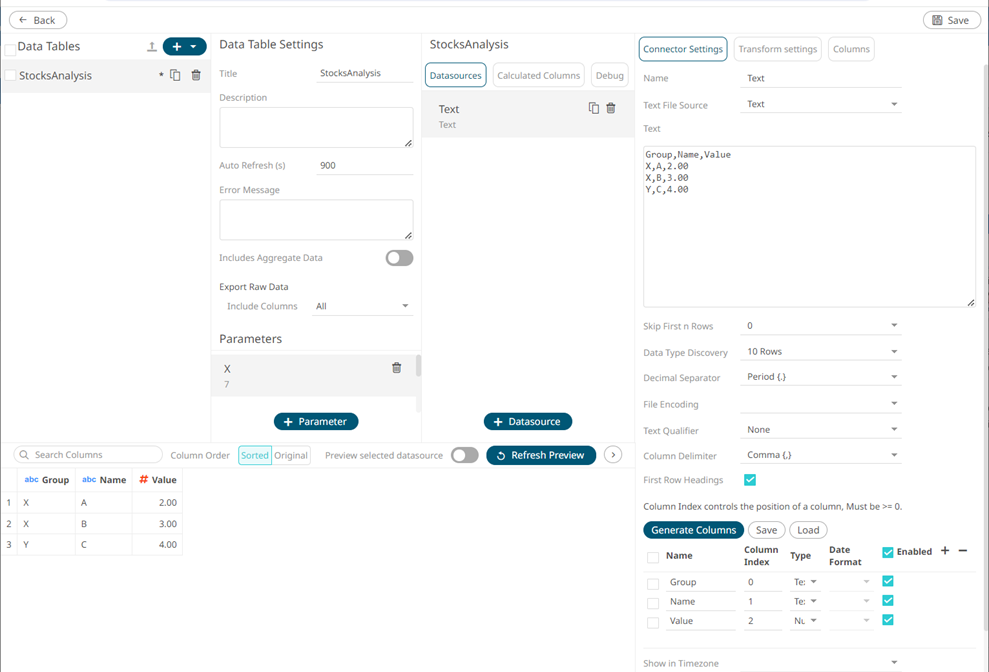
Then adding calculated columns AddOne = [Value] + 1 and AddX = [Value] + {X} will result to:
| Group | Name | Value | AddOne | AddX |
|
X |
A |
2.00 |
3.00 |
9.00 |
|
X |
B |
3.00 |
4.00 |
10.00 |
|
Y |
C |
4.00 |
5.00 |
11.00 |
Sample 1
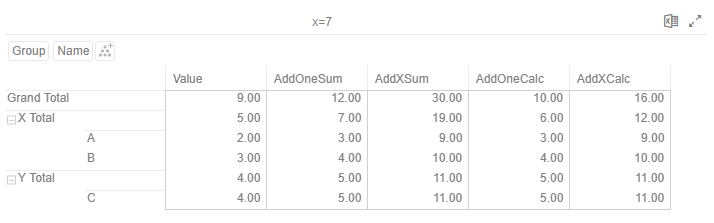
Below is the defined breakdown in a Table visualization:

This Table visualization shows the grouping of the columns based on the breakdown hierarchy with AddOneSum, AddXSum, AddOneCalc, AddXCalc as Visual Members with the corresponding aggregates and the X value is set to 7:
| Column | Aggregate |
|
Value |
Sum |
|
AddOneSum |
Sum |
|
AddXSum |
Sum |
|
AddOneCalc |
Calculation |
|
AddXCalc |
Calculation |
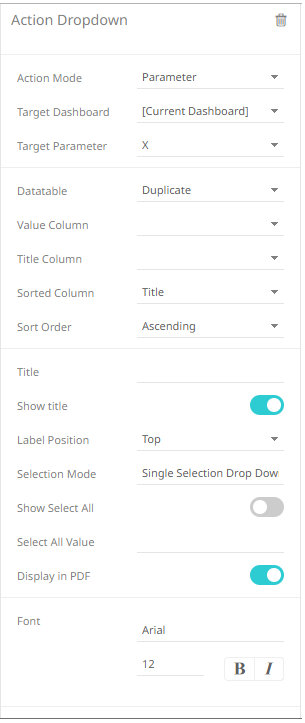
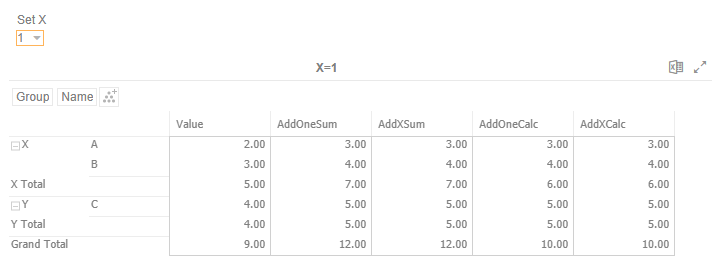
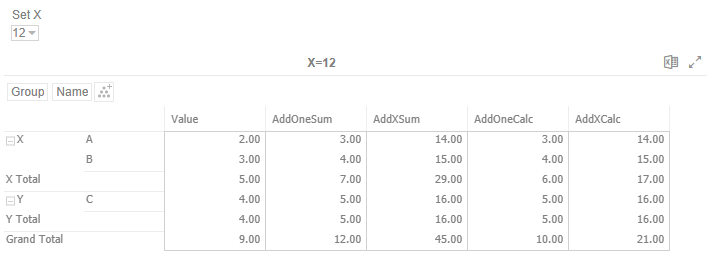
Adding an Action Dropdown in the dashboard with a Set Parameter mode:
And given Table 2:
| Value |
| 0 |
| 1 |
| 7 |
| 12 |
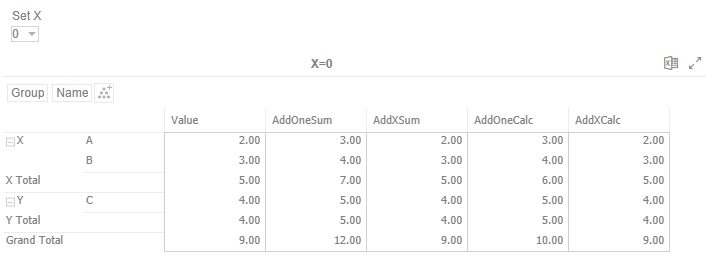
Will result to these Table values:
(c) 2013-2025 Altair Engineering Inc. All Rights Reserved.