Network Graph Settings
The Network Graph displays relationships between entities and can be used to identify correlations or flows between items.
NOTE: There have been several updates in the Network Graph in version 2026.0.
There are three layout modes available:
| Layout Mode | Description |
|
Circle |
All items are lined up in a circle and connections between items are drawn within the circle. |
|
CoSE [cosay] |
Compound Spring Embedder. This layout optimizes the use of the available screen real estate. |
|
Bredthfirst |
This layout organizes items in rows and is suitable for visualizing levels or hierarchy. |
As a designer, you can decide which layout algorithm should be used as default for each network graph, and users of the graph can alternate between layout algorithms from the context menu in the graph.
Suitable Data Structure for the Network Graph
The data used by the Network Graph consists of two kinds of data:
| Data | Description |
|
Data about nodes (items) that exist in the network |
The nodes have names and can also have various properties which describe them. Such properties – both numeric values and text values – are found in additional columns. Each node is a separate row of data. |
|
Data about links (edges) that exist in the network |
A link always involves two nodes: one from node and one to node. There can be any number of links between two given nodes. Each link can have properties which describe the link – both numeric values and text values. Such properties are found in additional columns. |
The following is a sample of a dataset describing some nodes:
| Node | Size | Category |
|
A |
3 |
Small |
|
B |
10 |
Large |
|
C |
11 |
Large |
|
D |
4 |
Small |
The following is a sample of a dataset describing some links between nodes:
| FromNode | ToNode | LinkDescription |
|
A |
B |
Employer |
|
B |
A |
Employee |
|
A |
C |
Neighbor |
|
C |
B |
Babysitter |
|
C |
B |
Cousin |
|
D |
D |
Hairdresser |
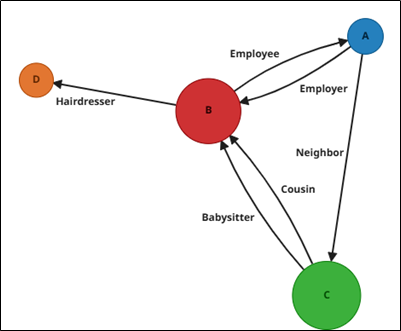
Based on this sample data, the following can be noted:
- There is a link from A to B, and a link from B to A
- There are two different links from C to B
- There is no link going from D. Therefore, it is important that D is included in the first dataset, containing all existing nodes, otherwise, D will not be displayed in the graph.
When using this example dataset in the Network Graph, the Nodes dataset and the Links dataset must be combined into one data table. You do that by making a left outer join between the Nodes dataset (left side) and the Links dataset (right side), using the column Node and the column FromNode as join keys. This can be done using the join feature in Panopticon, or outside Panopticon using other tools, before loading the data. The combined dataset, ready for use in the Network graph, looks like this:
| Node | Size | Category | ToNode | LinkDescription |
|
A |
3 |
Small |
B |
Employer |
|
A |
3 |
Small |
C |
Neighbor |
|
B |
10 |
Large |
A |
Employee |
|
B |
10 |
Large |
D |
Hairdresser |
|
C |
11 |
Large |
B |
Babysitter |
|
C |
11 |
Large |
B |
Cousin |
|
D |
4 |
Small |
|
|
A Network Graph based on this data, using the CoSE layout algorithm, can look like this:
Creating a Network Graph
In the settings of Network Graph, the most important settings pills are Nodes and Links.
- Start by dragging the column that contains the names or identities of all existing nodes to the Nodes pill.
- Click the Links pill to reach the setting labelled Link to Columns. Drag and drop the data column containing names or identities of nodes to which there are links (i.e., ToNode column in the sample data).
You now have the foundation of your network graph, which you can refine further by applying properties of nodes and links to the settings.
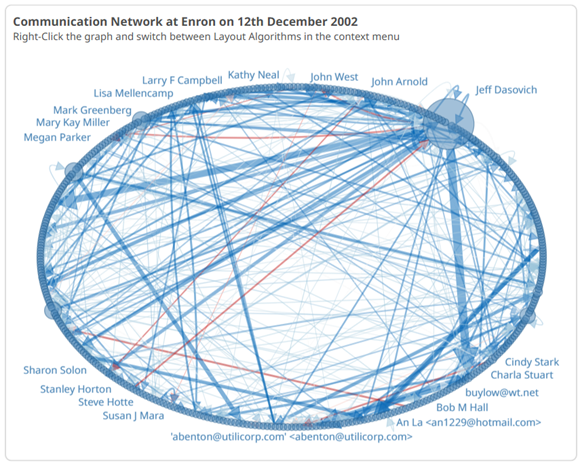
A ready-made Network Graph is available in the Examples bundle as shown below:
Node Properties
- Basic Settings
Setting Description Columns
This is where you set the data column containing the names or identities of all nodes (items) that exist in the dataset. You can add several columns, in case that is needed to uniquely identify the nodes. For example, with a column containing company names and a column containing country names, a combination of the two columns can be used to specify a company and its operations in a particular country, as opposed to just the company in general.
Layout Algorithm
Can be Circle, CoSE, or Bredthfirst.
Show Borders
Set to On or Off.
Min Radius
The minimum radius of any node, mapped to the lowest Size setting value in the data.
Max Radius
The maximum radius any node, mapped to the highest Size setting value in the data.
- Size Settings
The size of each node can be controlled by the numeric values in a column.
Setting Description Variable Title
The value title or label to be displayed in the Tooltip popup of the graph.
Aggregate
The aggregation method to use. For example, when a numeric property of the Node is used, a suitable aggregate is Mean, to avoid duplication of the value whenever the node has more than one link. When a numeric property of links is used, different aggregates can be relevant depending on the data and use case.
For the Column, Format, Divide By, and Range settings, see Size Variable Configuration.
- Color Settings
The nodes can be colored according to either a text value or a numeric value. The color settings work the same way as in all Panopticon graphs.
- Opacity Settings
Opacity less than 1 (i.e., some grade of transparency) is useful when a graph is very dense and has a lot of overlapping items.
- Label Settings
Any existing column can be used as a label. Columns already in use in the Nodes pill are automatically added under the Labels settings in a Hidden state and can be shown in the graph by switching them to Visible. When showing labels from several columns, the order of the labels is controlled by changing the order of the column names in the Label settings panel, by drag and drop. Columns used for Labels under the Nodes pill should specifically describe Nodes, not Links.
Links Properties
- Basics Settings
Setting Description Link-To Columns
This is where you set the data column containing the names or identities of all nodes (items) that exist in the dataset. You can add several columns, in case that is needed to uniquely identify the nodes. For example, with a column containing company names and a column containing country names, a combination of the two columns can be used to specify a company and its operations in a particular country, as opposed to just the company in general.
Group By
This setting is important whenever there are two or more links from one node to one other node. The column to apply to the Group By setting should uniquely describe each link between any two nodes. Without these settings, the graph will show one single link line representing all the links.
Show Directions
This setting puts an arrow at the end of each link line, indicating the difference between the From node to the To node. This is useful for emphasizing the direction of a flow, or to indicate dependency.
Min Thickness
The minimum thickness of any link, mapped to the lowest Size setting value in the data.
Max Thickness
The maximum thickness of any link, mapped to the highest Size setting value in the data.
- Size Settings
The size or thickness of each link can be controlled by the numeric values in a column.
Setting Description Variable Title
The value title or label to be displayed in the Tooltip popup of the graph.
Aggregate
The aggregation method to use. Different aggregates (e.g., Sum, Mean, or Count) can be relevant depending on the data and use case.
For the Column, Format, Divide By, and Range settings, see Size Variable Configuration.
- Color Settings
The links can be colored according to either a text value or a numeric value. The color settings work the same way as in all Panopticon graphs.
- Opacity Settings
Opacity less than 1 (i.e., some grade of transparency) is useful when a graph is very dense and has a lot of overlapping links.
- Label Settings
Any existing column can be used as a label. Columns already in use in the Links pill are automatically added under the Labels settings in a Hidden state and can be shown in the graph by switching them to Visible. When showing labels from several columns, the order of the labels is controlled by changing the order of the column names in the Label settings panel, by drag and drop. Columns used for Labels under the Links pill should specifically describe Links, not Nodes.
(c) 2013-2025 Altair Engineering Inc. All Rights Reserved.