Morphing Visualizations
You can morph a visualization by simply selecting the required resultant visualization from the available listing.
When used in combination with the copy and paste functionality, dashboards can be quickly created.
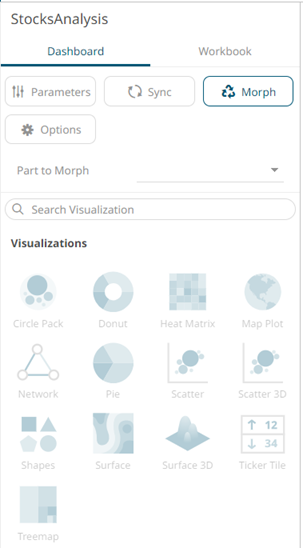
- On the Dashboard and Workbook Settings pane, click the Dashboard tab and then the
 button.
The Morph pane displays.
- Select the visualization to morph from the drop-down list.
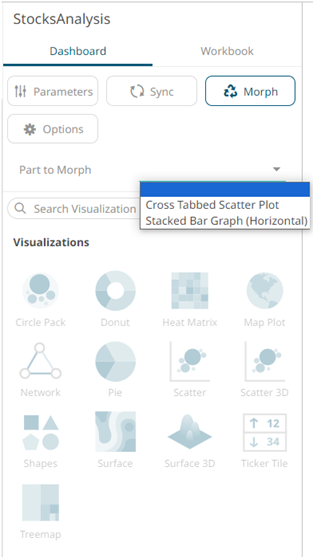
The list of visualizations is enabled.
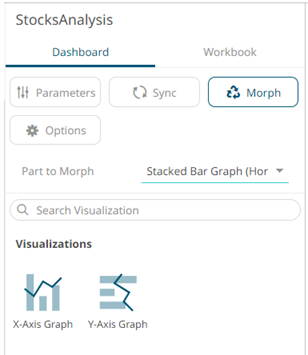
- Select another visualization on the list.
The visualization is changed to a new one.
NOTE:
When morphing between visualizations with the same variables, there is no further configuration required. For example, from a Horizontal Bar Graph to a Vertical Bar Graph.
However, when morphing between visualizations with different variables, the new visualization will need to be configured to include columns for empty variables. For example, when converting from a Pie Chart to a Scatter Plot, the X and Y axis must be defined.
(c) 2013-2025 Altair Engineering Inc. All Rights Reserved.