Grouping Columns in the Table Visualization
Visual members of a Table visualization can be grouped into sections.
- Open or create a Table visualization and add columns to the Records variable.
- Click the Records variable drop area to display the available visual.

NOTE: The inclusion of columns in a group will be based on their sequence in the Visual Members list.
For example, the following groups will be created:
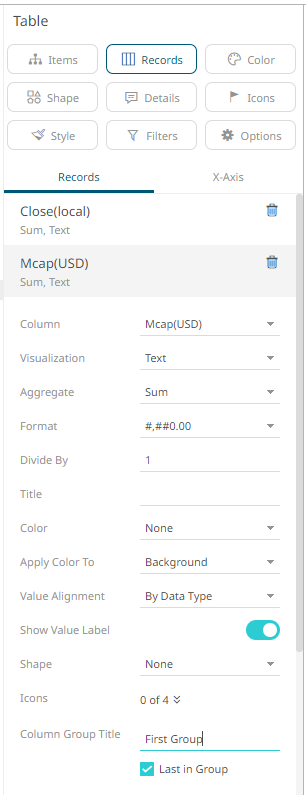
First group: Close(local) and Mcap(USD)
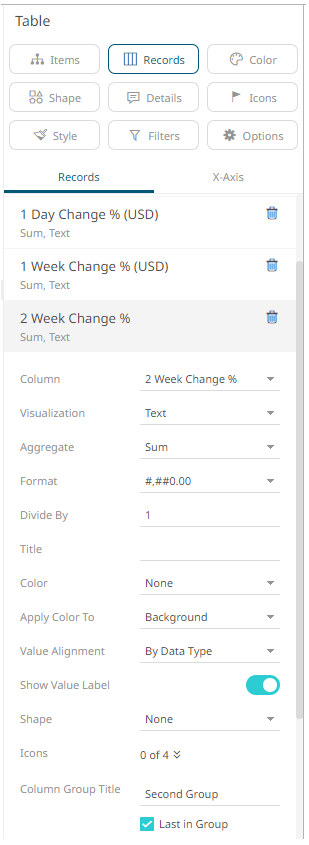
Second group: 1 Day Change % (USD), 1 Week Change % (USD), and 2 Week Change %
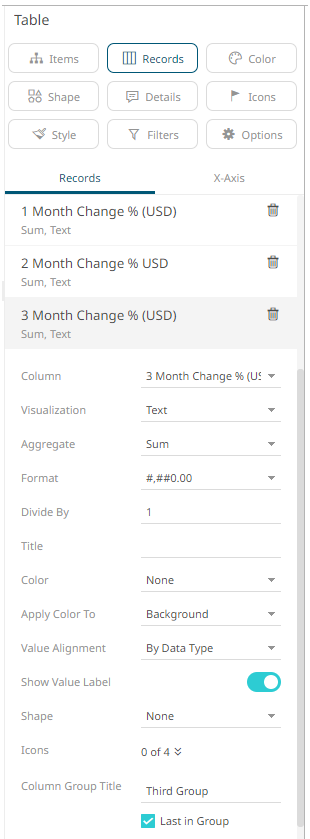
Third group: 1 Month Change % (USD), 2 Month Change % (USD), and 3 Month Change % (USD)
Forex and Symbol will not be included in any group. - For the groupings, click the following columns, select the Last in Group checkbox, enter the Column Group Title, and click
 :
:
- First group: Mcap(USD)
- Second group: 2 Week Change %
- Third group: 3 Month Change % (USD)
- First group: Mcap(USD)
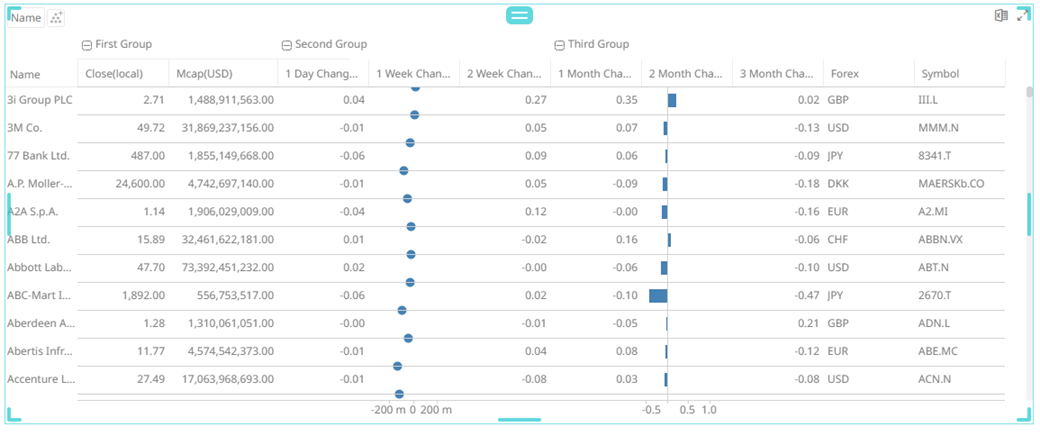
The groupings are applied to the Table visualization.
(c) 2013-2025 Altair Engineering Inc. All Rights Reserved.