Funnel Chart Settings (Legacy)
Funnel Charts are a type of Bar Graph, often used to represent stages in a sales process or order fulfillment process and can show the amount of potential revenue for each stage.
This type of chart can be useful in identifying potential problems in an organization's sales process.
Color can be used to represent either a Stage in the process, or the change in performance for that stage against a prior period.
Alternatives to the Funnel Chart would be a simple Bar Graph, or a Stacked Bar Graph.
The funnel chart settings pane is displayed after clicking the Options  button.
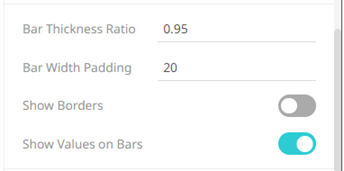
| Setting | Description |
| Bar Thickness Ratio | Specifies the thickness ratio of the bars and spaces between bars. |
| Bar Width Padding | Specifies the width padding between the bar and the border. |
| Show Borders | Determines if a border is drawn around each bar. |
| Show Values on Bars | Determines if values are displayed in bars. |
(c) 2013-2025 Altair Engineering Inc. All Rights Reserved.