Creating Custom Shapes
SVG-files with path expressions describing custom shapes are easy to create for simple shapes.
NOTE: The x-y coordinate system in the Panopticon Shapes visualization has positive x-values going right and positive y-values going DOWN, not up. An empty shape visualization has origo (0,0) at the top-left corner.
In the d-attribute of the path element, the following commands/instructions are supported by the Shapes visualization in Panopticon:
M,m (moveto): http://www.w3.org/TR/SVG/paths.html#PathDataMovetoCommands
Z,z (closepath): http://www.w3.org/TR/SVG/paths.html#PathDataClosePathCommand
L,l (lineto): http://www.w3.org/TR/SVG/paths.html#PathDataLinetoCommands
H,h (horizontal lineto): http://www.w3.org/TR/SVG/paths.html#PathDataLinetoCommands
V,v (vertical lineto): http://www.w3.org/TR/SVG/paths.html#PathDataLinetoCommands
C,c (curveto): http://www.w3.org/TR/SVG/paths.html#PathDataCubicBezierCommands
S,s (smooth curveto): http://www.w3.org/TR/SVG/paths.html#PathDataCubicBezierCommands
Q,q (quadratic Bézier curveto): ttps://www.w3.org/TR/SVG/paths.html#PathDataQuadraticBezierCommands
T,t (smooth quadratic Bézier curveto): https://www.w3.org/TR/SVG/paths.html#PathDataQuadraticBezierCommands
NOTE: Upper case commands set the absolute points, while the lower case commands set the relative points.
The following code, saved in a text file with the file extension .svg, can be read with the SVG connector in Panopticon and will produce 2 columns: NodeKey1, which contains the id-values for the g-tags, and ShapeData, which contains the d-value of the path-tags. The ShapeData column can then be applied to the Shapes variable of the Shapes visualization part.
<svg>
<g id="Square Example">
<path d="M 1,1 h 9 v 9 h -9 v -9 z" />
</g>
<g id="Triangle Example">
<path d="M 11,10 h 10 l -5,-10 l -5,10 z" />
</g>
<g id="Circle Example">
<path d="M 0.5,17 c0.5,6.667 9.5,6.667 10,0 -0.5,-6.667 -9.5,-6.667 -10,0 z" />
</g>
<g id="Hexagon Example">
<path d="M 20.5,14.5 l -4.33,-2.5 -4.33,2.5 0,5 4.33,2.5 4.33,-2.5 0,-5 z" />
</g>
</svg>

The same data can be provided in a tabular form, loaded with the Text connector or from a database. For example:
NodeKey1,ShapeData
Square Example,|M 1 1 h 9 v 9 h -9 v -9 z
Triangle Example,|M 11 10 h 10 l -5 -10 l -5 10 z
Circle Example,|M 0.5 17 c 0.5 6.667 9.5 6.667 10 0 c -0.5 -6.667 -9.5 -6.667 -10 0 z
Hexagon Example,|M 20.5 14.5 l -4.33 -2.5 l -4.33 2.5 l 0 5 l 4.33 2.5 l 4.33 -2.5 l 0 -5 z
Likewise, this data can be used with the Shapes variable of the Shapes visualization part.
NOTE: When shape paths are loaded from a tabular data, each path must begin with a vertical bar character (“pipe”).
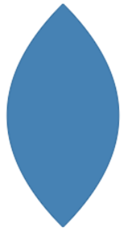
This is a minimal example of a shape created with the Q command:
<svg>
<g id="1">
<path d="M 50,20
Q 80,50 50,80
Q 20,50 50,20"/>
</g>
</svg>
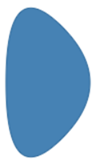
This is the same example as the previous one, with the difference that the T command has been used instead.
NOTE: Creating a simple shape using the T (smooth quadratic Bézier curveto) command requires an initial Q command to define the first control point.
<svg>
<g id="2">
<path d="M 50,20
Q 80,50 50,80
T 20,50
T 50,20"/>
</g>
</svg>
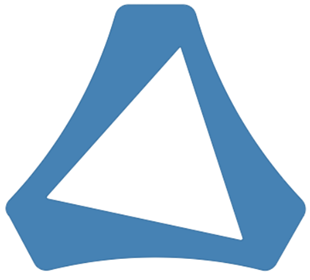
A larger example, that combines several different commands such as H, L, C, c, to form the Altair Engineering logotype:
<svg>
<g id="altair">
<path d="M 71.4 47.1 c -12 -12.7 -20.8 -28 -25.6 -44.8 c -0.4 -1.4 -1.6 -2.3 -3 -2.3
H 29.5 c -1.4 0 -2.6 1 -3 2.3 C 21.7 19.1 12.9 34.4.9 47.1 c -1 1 -1.2 2.6 -.05 3.8
L 7 62.4 c 0.7 1.2 2.1 1.8 3.5 1.5 8.4 -2.1 17 -3.1 25.6 -3.1 8.6 0 17.3 1 25.6 3.1 1.4 0.4 2.8 -0.3 3.5 -1.5 l6.6 -11.6
c 0.7 -1.2 0.5 -2.7 -0.4 -3.7
zm -14.7 9.7l -46.6 -10
c -0.2 -0.1 -0.4 -0.3 -0.3 -0.5 0 -0.1 0 -0.1 0.1 -0.2 l 31.9 -35.8
c 0.1 -0.2 0.4 -0.2 0.5 0 l.1 0.1 14.8 45.8
c 0.1 0.2 -0.1 0.5 -0.3 0.5 -0.1 0.1 -0.1 0.1 -0.2 0.1 z" />
</g>
</svg>
(c) 2013-2025 Altair Engineering Inc. All Rights Reserved.