Adding Time Buckets in Data Table Editor
Time based data can be represented as continuous Time Series and displayed in time series visualizations such as the Line Graph. However, there are circumstances when data analysis does not require continuous time but instead requires time grouping and aggregation. Time parts support this categorical use of time.
To group and aggregate time-based data, a Date/Time column should be present in the data table.
- On the Calculated Columns pane, click New Column > Time Bucket.
The Date/Time column (e.g., Maturity Date) that will be used for the time bucketing is displayed.
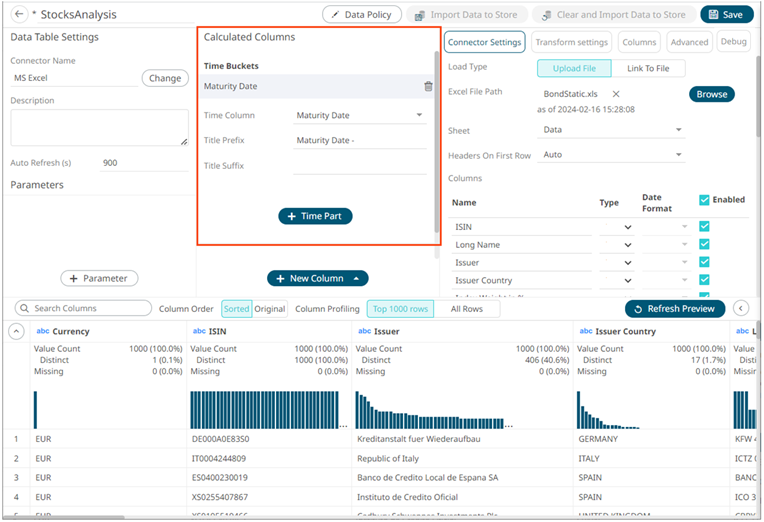
- Modify Title Prefix and enter Title Suffix if needed.
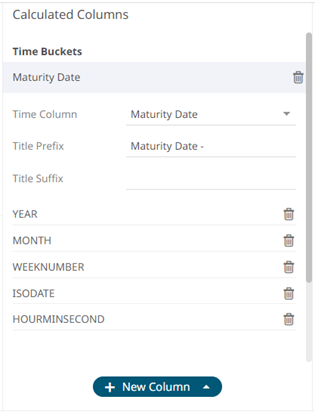
- Click
 to add the required time parts. Click
  of the time parts that should not be included. For example:
- Click
 . The new time bucketing columns are added and displayed in the Data Preview.
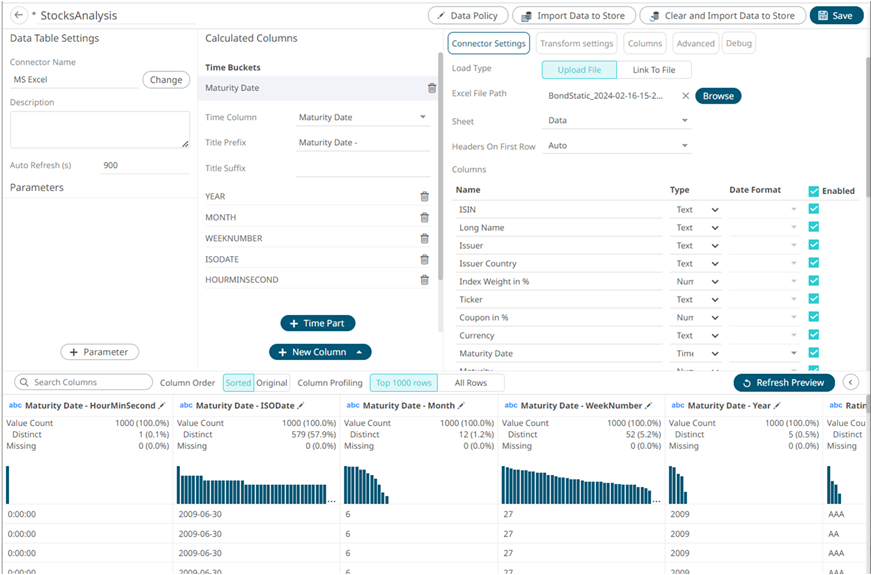
This process adds additional text columns to the data table which can be used in:
- Hierarchies / Breakdowns
- Filters
- Color Variables
- Detail Variables
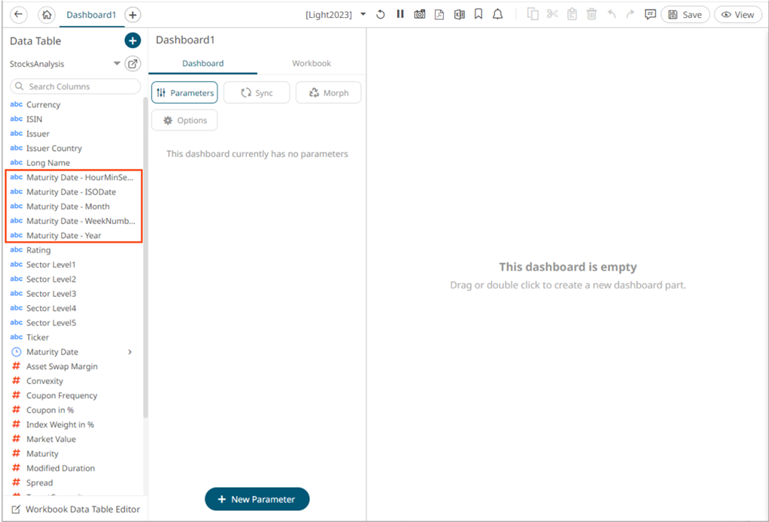
Once selected the new time bucket columns will appear in the data table schema listing.
As an example, the data set below relates to a EURO dominated Bond universe:
Each individual bond represents a row within the data set and has associated properties represented by each column.
The Maturity Date represents the date to which the Bond matures.
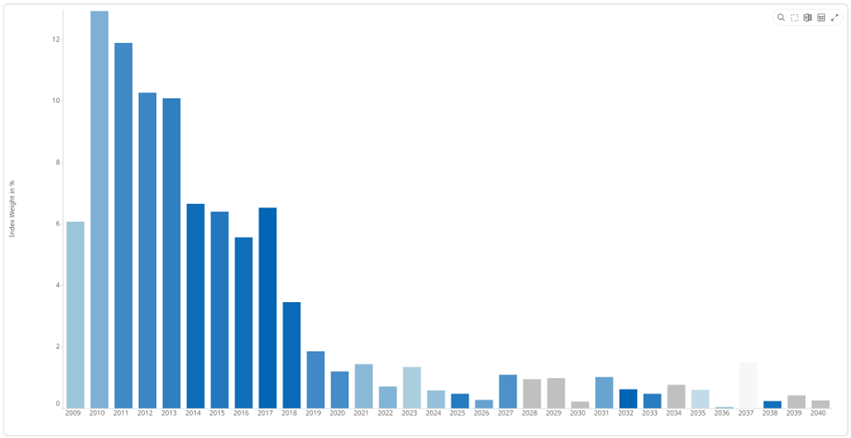
By creating the Year Time Part, a Bar graph of Maturity Year can be displayed:
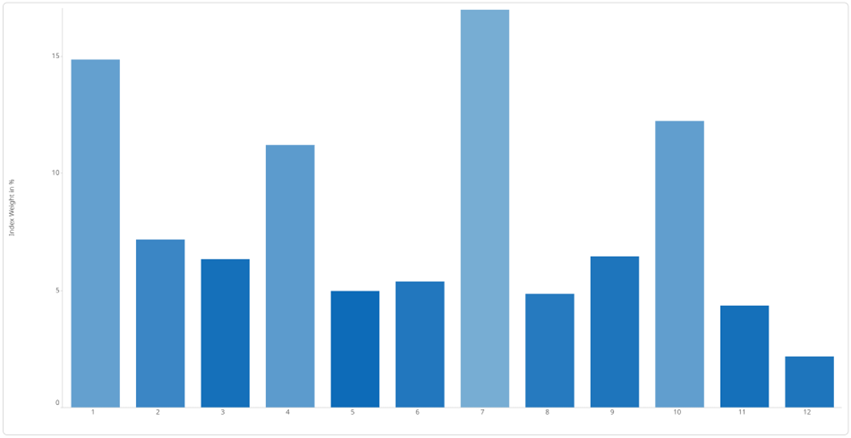
Similarly using the Month Time Part, a Bar graph of cumulative issuance by Month can be displayed:
(c) 2013-2025 Altair Engineering Inc. All Rights Reserved.