Adding Breakdowns
You can define several breakdowns for a visualization.
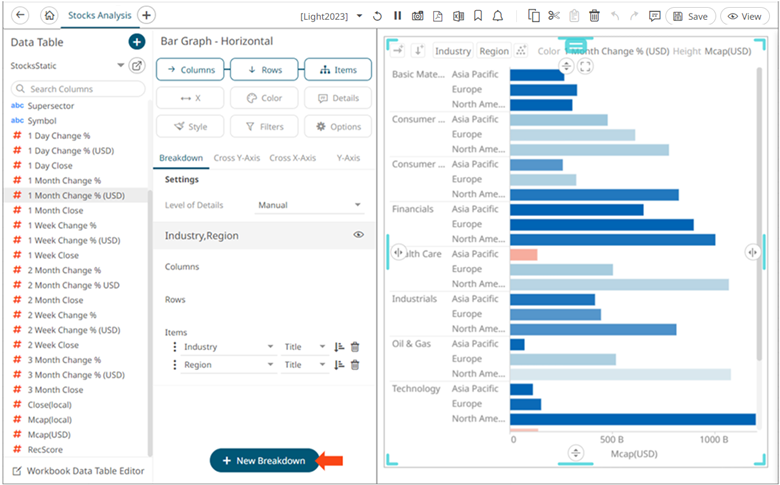
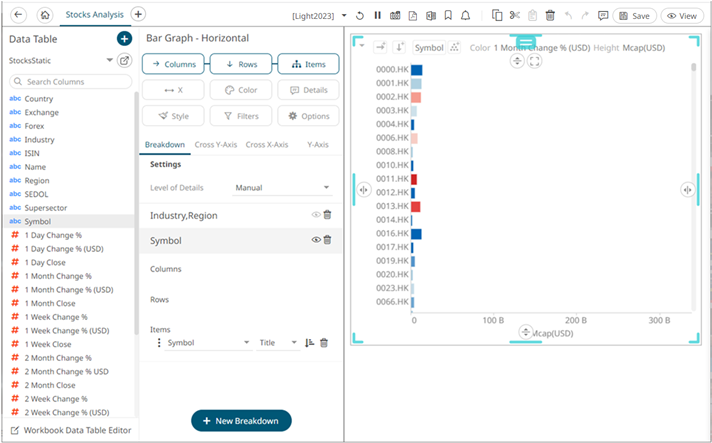
- Under the Breakdown tab, click New Breakdown
 .
.
A new Empty breakdown definition is added under the Breakdown tab with the View
 icon turned on. The visualization also shows a single bar.
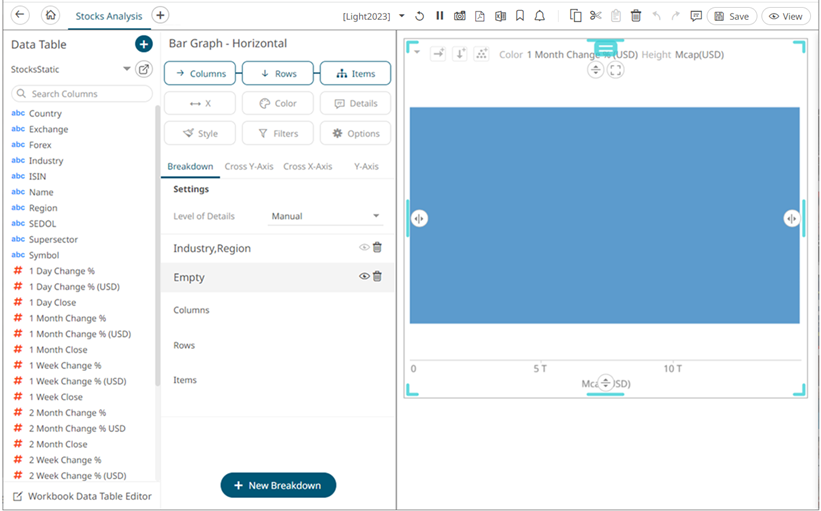
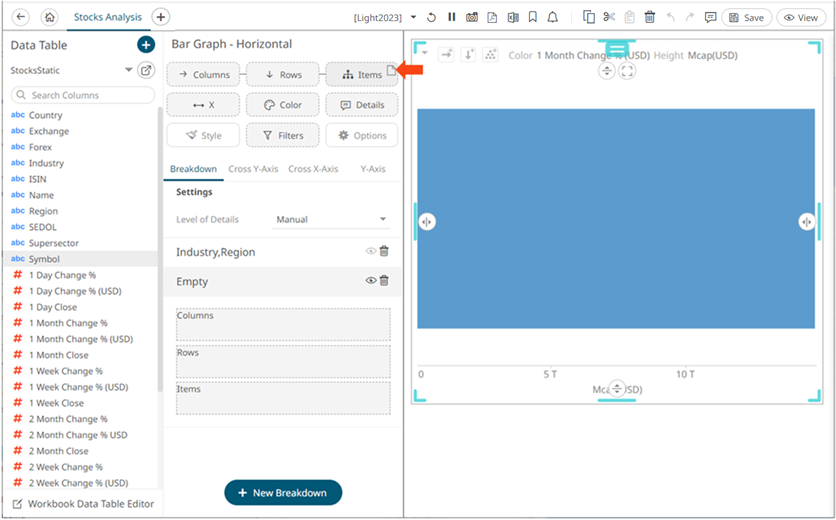
- To add more breakdown levels, drag text columns to the Items pill or drop area.
After dragging a data column to a breakdown, this will break apart the aggregated data into separate bars and the column is added under the Items drop area of the Breakdown tab and Breakdown section of the visualization. Also, the dragged column will replace the Empty state name.
You can have as many levels in the breakdown as you like, although the best practice is to limit the hierarchy to five or fewer levels.
- Click the Save
 icon on the toolbar.
Selecting Other Breakdowns
To select the breakdown to use on the visualization, you can either double-click on an instance or click the View  icon to turn it on . Note that if there are several breakdowns in a visualization, you must select one to use.
Deleting Breakdowns
Select a breakdown under the Breakdown tab of the Visualization Settings pane and click  .
.
(c) 2013-2025 Altair Engineering Inc. All Rights Reserved.