Ad Hoc PDF Generation
Select the dashboards to be included in the generated PDF.
NOTE: Before exporting to PDF, ensure the workbook is saved first.
- Click the Create PDF Report
 icon on the toolbar.
The PDF Settings dialog displays.
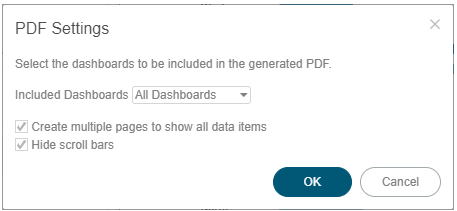
- Select the dashboards to be included:
Some visualizations show a portion of the available content adding scroll bars. E.g., table, horizon graph, etc.
The final two options of the dialog relate to these visualizations.
- All dashboards
- Current dashboard
- Selected
The checkboxes are enabled and all the dashboards are checked by default.
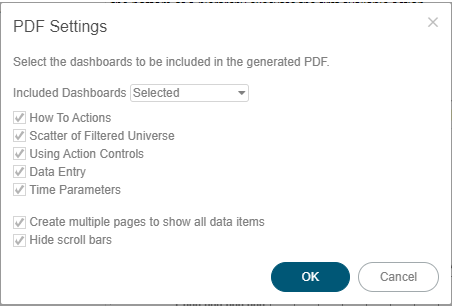
Check only those that will be included in the generated PDF.
- To output all the content within a visualization that has scroll bars, for example, to output all the rows within a table, select the Create multiple pages to show all data items checkbox.
- To hide scroll bars from the output PDF pages, select the Hide scroll bars checkbox.
- Click
 button to start the PDF generation.
This will allow Panopticon Real Time to read all the datasets necessary to output the dashboard and produce the PDF file.
NOTE: Ad hoc PDF generation in the Web client using Google Chrome (or other browsers) may be hindered by the AdBlock Extension. To remove the AdBlock Extension in Google Chrome, perform these steps:
- Click the Chrome Menu
 icon on the browser toolbar.
 - Highlight Tools, then click Extensions from the sub-menu.
- Click Remove in the AdBlock Plus entry (e.g., uBlockOrigin).
- Click Remove in the confirmation message that displays.
(c) 2013-2025 Altair Engineering Inc. All Rights Reserved.