3D Surface Plot Settings
3D Surface Plots are a 3D perspective version of the 2D Surface Plot.
They provide a clearer understanding of the overall “shape” of the surface, but they also introduce occlusion problems; not all data points can be seen due to the display perspective.
The Surface Plot 3D is made up of a series of points where each point has:
- X Position
- Y Position
- Z Position (encoded by color)
The Surface Plot 3D can support data sets where the X and Y positions can both be regular and irregular in their distribution.
The color scale can be continuous or stepped to show a surface gradient.
Grid lines, a ground plane, and markers for data points can be shown if required.
The 3D surface plot settings pane is displayed after clicking the Options  button.
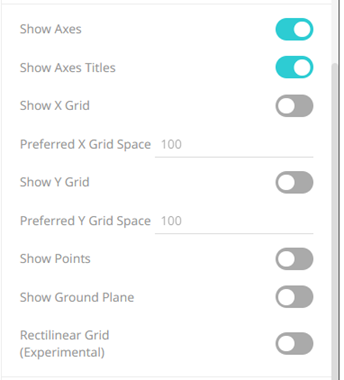
| Setting | Description |
|
Show Axes |
Determines whether axes are displayed. |
|
Show Axes Titles |
Determines whether axes titles are displayed. |
|
Show X Grid |
Determines whether the X Grid lines are displayed and if checked the space in pixels between them. |
|
Preferred X Grid Space |
Specifies the X Grid lines spacing. Default is 100. |
|
Show Y Grid |
Determines whether the Y Grid lines are displayed and if checked the space in pixels between them. |
|
Preferred Y Grid Space |
Specifies the Y Grid lines spacing. Default is 100. |
|
Show Points |
Determines whether markers are drawn over surface data points. |
|
Show Ground Plane |
Determines whether a ground plane should be drawn below the 3D surface |
|
Rectilinear Grid |
Determines whether distinct X and Y values are changed into a rectilinear grid where missing values are filled in with a default of zero (or the ground level). |
(c) 2013-2025 Altair Engineering Inc. All Rights Reserved.