Using the Multi-Column Region Trapping Feature
Monarch Data Prep Studio's multi-column region (MCR) trapping capability enables users to trap and extract data from reports that have a layout similar to that of a newspaper, i.e., ones with multiple, adjacent columns of data on each page.
General Steps when Trapping Data via the MCR Feature
-
Open the report you want to extract data in the Report Design window.
-
Specify PDF import options if necessary to align columns properly.
-
Define the multi-column region via the Multi-Column Region Definition tool.
-
Create a template to extract the data from the report.
-
Specify the vertical boundaries (i.e., beginning and ending points) for the columns.
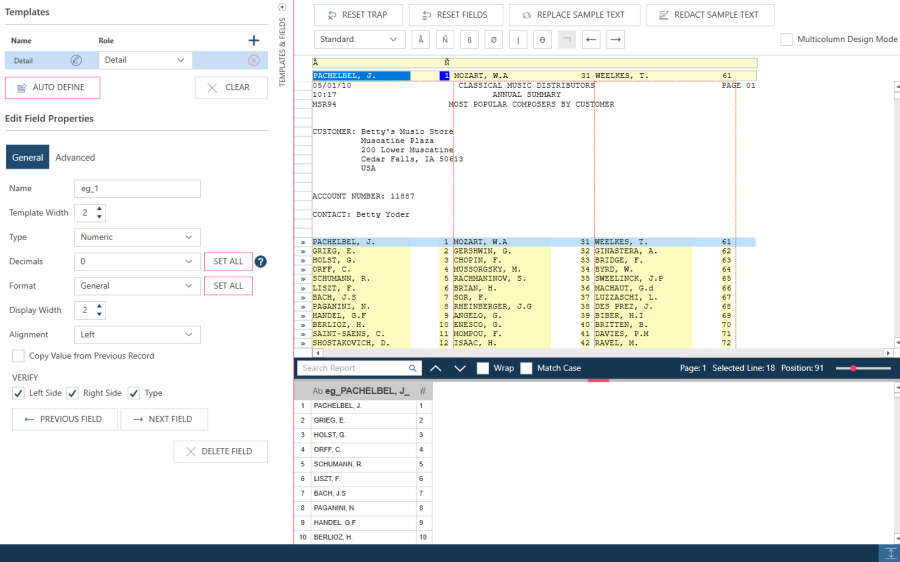
Open the report you want to extract data in the Report Design window. In this example, we'll use Composers.pdf, which is which is usually available in C:\Users\Public\Documents\Altair Monarch\Reports. Composers.pdf lists the names of 90 composers, arranged in three columns of 30 names, and ranked in order of popularity (1 = most popular, 90 = least popular) for each customer.
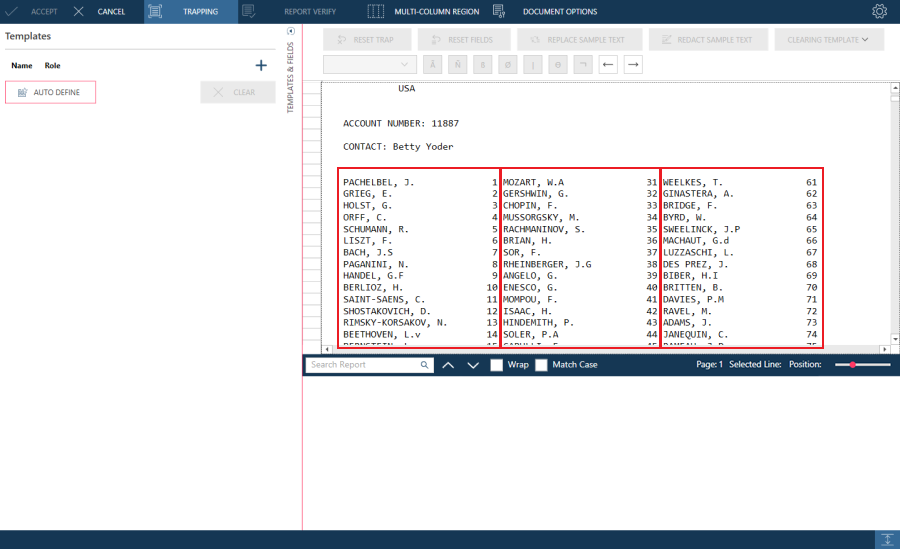
A careful check of the columns in the report above shows that the first column is skewed. In the actual PDF file, this column is straight. This inconsistency is a good indication that you need to modify your PDF import settings.
Using the MCR Trapping Feature in Detail
-
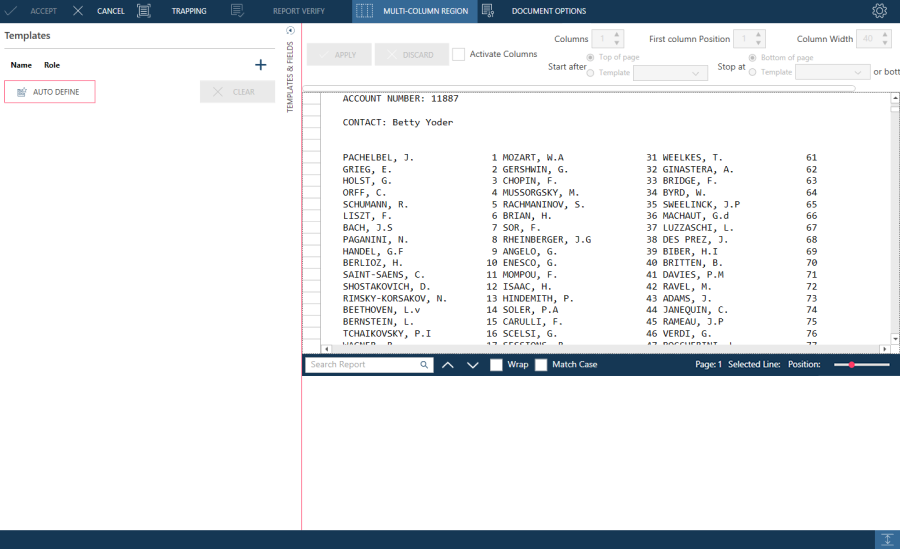
Open the report from which you want to extract multiple-column data in Report Design and then select the Multi-Column Region tool. The Multi-Column Region Definition toolbar displays.
-
Select Activate Columns from this toolbar to activate the definition window.
-
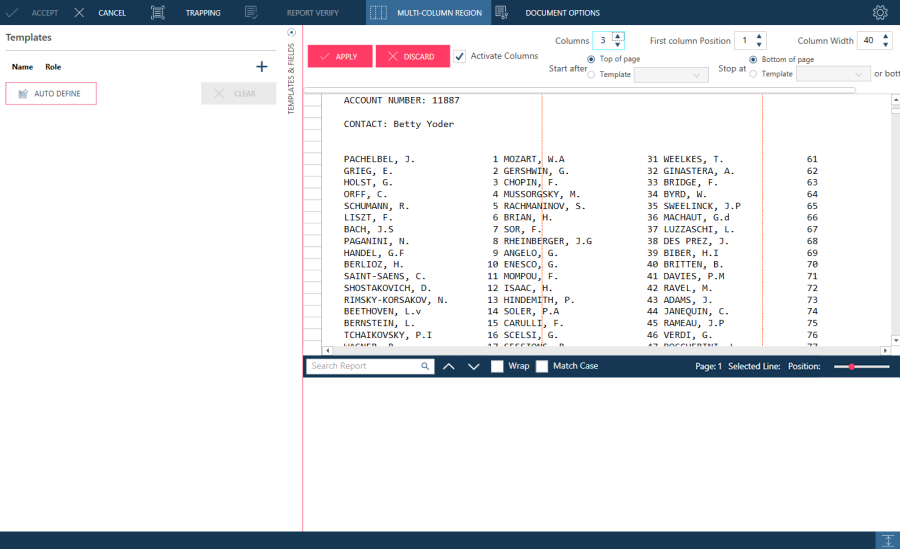
Examine the report to determine how many columns of data there are, then enter the number in the Number of Columns field.
A series of red, vertical broken lines, or column indicators, appears over the report to indicate where the columns currently are. The number of columns you specified determines the number of column indicators that appear (e.g., if you specified 3 in the Columns box, three column indicators appear).
-
Use the First Column Position box to specify a left margin for the leftmost column, i.e., the position where you want the leftmost column to begin. The column indicators are shifted to the left according to the number of spaces you entered in the box.
Note: The default First Column Position setting is "1." If the text in the left-most column begins at the left edge of the report, leave the setting at "1". If the text begins one space in from the left edge of the report, enter "2". If the text begins two spaces in from the edge of the report, enter "3", and so on.
-
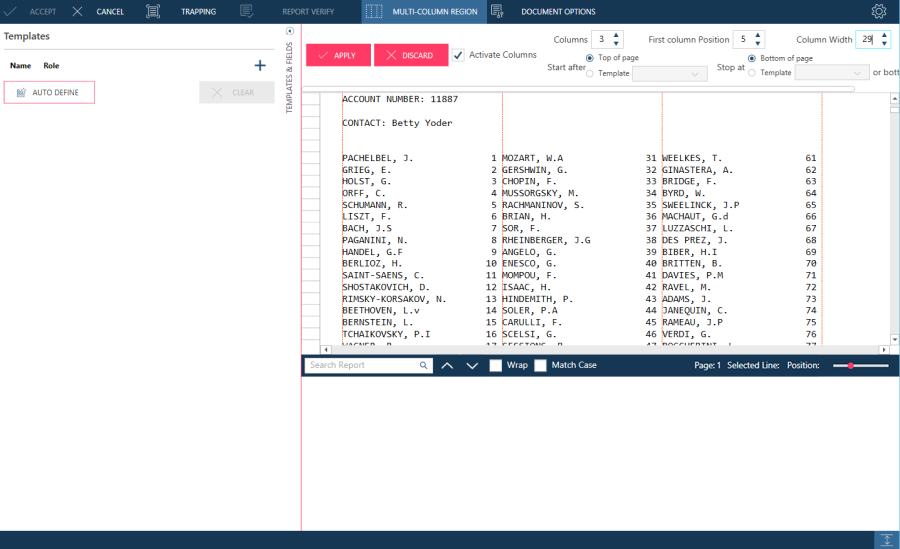
Use the Column Width box to specify the desired column width. To do so, either enter a number in the box or use the arrows to increase or decrease the current column width.
The column indicators move to reflect the change to the column width. Examine the current column width and, if necessary, adjust it so that each column of data is entirely contained within each column as outlined by the column indicators.
Once you have determined the number of columns, the starting position of the left-most column, and the column width, you are ready to define the template.
-
Click the Apply button on the MCR definition toolbar to accept the current MCR settings. Note that the column indicators are still displayed on the Report window.
-
Select a sample line for which you wish to create a template.
-
In the Report Design window, click + (Add a New Template) and then select a template role from the options available.
-
Create traps to extract the desired fields, as you would with any non-MCR template and then save the template.
-
Select Report Verify from the Report Design ribbon to make sure the fields in your template have been defined properly.
Creating Vertical Boundaries
-
If you have templates defined before and/or after your newly created template, you may need to specify vertical boundaries.
-
Select the Multi-Column Region tab once more. The Multi-Column Region Definition panel displays.
-
Select a Start After option from the drop-down provided to specify the top boundary of the MCR.
Select the Top of Page option to begin the MCR at the top of the page. To begin the MCR immediately after a particular template, select this template from the drop-down list.
Note that the top boundary line of the MCR (i.e., the red, horizontal broken line at the top of the columns) is adjusted to reflect the setting you’ve specified. This line indicates the top boundary of the multi-column region. Everything above this line is excluded from the MCR.
-
Select a Stop After option to specify the bottom boundary of the MCR.
Select the Bottom of Page option to end the MCR at the bottom of the page. To end the MCR immediately before a particular template, select this template from the drop-down list.
Note that the bottom boundary line of the MCR (i.e., the red, horizontal broken line at the bottom of the columns) is adjusted to reflect the setting you’ve specified. This line indicates the bottom boundary of the multi-column region. Everything below this line is excluded from the MCR.
Note: As you can see, templates can be very helpful when specifying the top and bottom boundary settings of the MCR. Keep this in mind, as you can create blank or dummy traps solely for this purpose.
-
Click Accept to save the current MCR settings and then click Accept in the Report Design window to save your template.
© 2024 Altair Engineering Inc. All Rights Reserved.