Post-Processing
Use the Show Analysis Results tool to view the results of an analysis in the Analysis Explorer. View and animate results, add callouts, and compare results from different runs.
Results must be available before attempting post-processing.
-
From the Extrusion ribbon, click
the Analysis tool.

Post-processing mode is activated.
Animate and Record Results
Use the Animation Toolbar that appears at the bottom of the modeling window to animate and record results.
Animate the Results
If you've previously run an analysis, click the Play button on the animation toolbar to animate the results.
-
Click the
 button on the
animation toolbar to review the analysis. Click the
button on the
animation toolbar to review the analysis. Click the  button to pause
the animation.
button to pause
the animation.
- Optional:
Click the
 icon to change the animation settings.
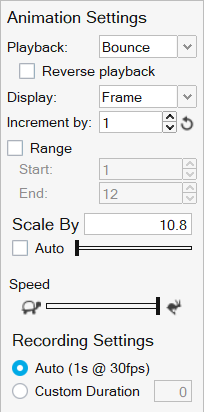
- Right-click and mouse through the check mark to exit, or double-right-click.
Record the Results
Capture to a video in .mp4 format by clicking the ![]() button on the animation toolbar.
button on the animation toolbar.
- If you haven't already done so, play back your results to get an idea of what you're about to record.
- Optional:
If desired, click the icon to change the animation settings.
-
Click the
 button on the animation toolbar to begin recording
the motion results; the icon changes to red to indicate that it is recording.
Click the icon again to stop recording.
button on the animation toolbar to begin recording
the motion results; the icon changes to red to indicate that it is recording.
Click the icon again to stop recording.
- When the recording is finished, the video is automatically saved in the C:\Users\<yourname>\Documents\Altair\videos directory. It is automatically given a name constructed from the time stamp, i.e. recording2018.8.8_15.47.39.mp4.
- Right-click to exit review mode.
- The default behavior is continuous recording, but the recording will stop automatically if the playback option is set to Once rather than Loop.
- To hide the workflow help, select , and in the Workspace category clear the Show workflow help checkbox.
- To avoid recording the mouse cursor, click the
 button on the animation toolbar and press the
Tab key to move the focus to the button. Then press the Spacebar to start or
stop the recording.
button on the animation toolbar and press the
Tab key to move the focus to the button. Then press the Spacebar to start or
stop the recording. - Note that the video recorder captures everything in the region of the modeling window. Avoid obscuring or minimizing that window during the recording process.
Animation Options
The animation options on the Analysis Explorer allow you to start and stop the animation and adjust basic settings.
| Option | Description | |
|---|---|---|
| Play/Stop Animation |  |
Animate the selected result. |
| Animation Speed | Change the speed of the animation. | |
Animation Toolbar
Use the animation toolbar to play, record, and configure the animation.

Figure 1. Animation Toolbar
- Animation Settings
- Click to open the Animation Settings.
- Play and Record/Stop Recording
- Click the button to begin recording the results; the icon changes to red to indicate that it is recording. Click the icon again to stop recording.
- Start Animation/Pause Animation
- Click the button to start or pause the animation. Use the arrow buttons to jump the first or last frame in the animation.
- Move to First/Previous/Next/Last Step
- These buttons allow you to step through the animation frame-by-frame. If you hold down the Previous or Next button, it will auto-repeat. If you want to skip frames, use the Increment By feature in the Animation Settings; hold Ctrl to temporarily override this behavior.
- Slider
- Drag the slider on the toolbar to view a particular point during the analysis; use the arrow keys to move frame-by-frame through the animation.
- Current Step
- Displays the current time or frame. You can also enter a value to go to the nearest time/frame.
Animation Settings
Modify the animation settings from the animation toolbar.
Figure 2. Animation Settings
- Playback
- Select whether to play the animation on a continuous Loop, Once, or Bounce (between forwards and backwards). Select the check box to Reverse Playback.
- Display
- Set the units for the slider to either Time or Frame.
- Increment By
- Increase the value in the counter to skip frames during playback. The reset button restores the default value of 1.
- Speed
- Drag the slider to change the speed of the animation.
- Range
- Select the Range checkbox to define and starting and ending frame for the
animation. This allows you to limit the playback range to just a portion of
the animation, making it easier to study behaviors in more detail. You can
use the Ctrl key while clicking on the Start or End icons to jump to Range
Start and Range End, respectively. Note: For motion models, you can fit plots for the selected range by using the Ctrl key while double-clicking. Also, the paths of tracers will be trimmed to honor the specified range.
- Scale Factor
- Enter a custom value to change the scale of the animation. Generally the scale of a displacement is too small to see clearly, so auto scaling is enabled by default.
- Recording Settings
- The default Auto setting gives you an estimate of the duration of the recording at 30 frames per second. If your video plays back faster than you want, select Custom Duration to change the length of the video; this will adjust the frame rate to try to achieve the specified duration. The Custom Duration has a minimum value of 1 second, and maximum value of 30 seconds.
Animation Shortcuts
| To | Do this |
|---|---|
| Play and pause | If the Play button is active, press the Spacebar. |
| Go to the first/last frame | Press the Home or End key. |
| Go to the next/previous frame | Press the Page Up or Page Down key. |
| Increment the slider |
Use the arrow keys to move frame-by-frame through the animation, or position the cursor over the slider and use the scroll wheel. |
| Exit tool | Right-click and mouse through the check mark to exit, or double-right-click. |
Result Types
| Option | Description |
|---|---|
| Displacement | The displacement plot gives a measure how much the nose cone has deformed. The displacements are computed from the velocities and these show how the profile nose-cone evolves. In addition, the displacements can be used to see if the profile meets dimensional tolerances. This result is qualitative and helps to determine if the die is well balanced. |
| Pressure | The pressure at the ram end provides the extrusion force required
to push the billet. This data also provides information on the
resulting extrusion loads on the die surfaces. This data is used to
predict tool deflection. Pressure in the weld chamber helps to create good welds. Weld strength is higher if the ratio of pressure to flow stress is higher in this region. Pressure also affects the friction in the bearing region. |
| Temperature | Flow stress of a material is a strong function of temperature
and strain rate. In addition, key material characteristics such as
grain size depend on temperature. Hence, understanding the
temperature distribution is the key to successful extrusion.
Temperature data is used to determine where excessive heating occurs in the die due to stress work. Temperature distribution in the profile region is used to determine the surface quality and other material characteristics. In the profile region, temperature variations of about 5% or less are acceptable. For high end applications, there are tighter tolerances. |
| Velocity | This data provides a detailed understanding of how material deforms and flows during extrusion. Using this data, we can detect flow imbalances at the die exit. In the case of multi-hole dies, we can determine how fast the profile is exiting from each hole and the resulting profile length during each cycle. Studying the material flow in die regions such as portholes and pockets can help redesign to improve the performance of the die. |
| Flow Stress | The flow stress of an alloy is a function of temperature, effective strain rate, and effective strain and describes how a material viscoplastically deforms during the process. This is a scalar result. The solver uses constitutive laws such as Sellars-Tegart, Metal Forming Power Law, and Hensel-Spittel models to compute the flow stress. You will find the details of these models in the Reference section. The local flow stress in comparison with the local pressure serves as a useful measure of weld stress in that region. It is also useful in understanding wear on contact surfaces and in modeling friction (viscoplastic friction laws). |
| Strain | The strain plot represents a measure of how the material is deforming and quantifies the change in the shape with respect to its original billet cross-section. |
| Billet Interface | The HyperXtrude solver calculates the transverse or charge weld
length during billet-on-billet extrusion. This requires running a
transient analysis. Extrusion is a cyclic process. After the first billet is extruded, the butt is sheared, and a new billet is put in place. The material inside the die gets displaced by the new billet during the new billet cycle. Hence, the front portion of the extruded part will have a mixture of both new and old billet material. This region is weak and discarded as scrap. Billet Interface contour helps in tracking how and when the profile will have 100% new material. By redesigning portholes and weld chamber, this scrap can be reduced. |
| Billet Skin | The HyperXtrude solver predicts how the impurities on the billet
skin migrate into the profile. This requires running a transient
analysis. The billet skin can get into the profile in two ways:
|
| Yield Stress | Yield stress is calculated from the grain diameters at the die exit. |
| Grain Size |
For advanced applications like automotive and aerospace, it is very important to control grain structure. Uniform and small grain structure leads to higher product strength. Grain size distribution depends on various process parameters, alloy, and die design. Grain size contour represents how the re-crystallization occurs during the extrusion. |
| Relative Exit Speed Difference | This data directly correlates to whether the extrusion is balanced or not. The values are a relative percentage difference of local speed compared to average extrusion speed. Hence, a value close to zero means the extrusion die is balanced, and higher percentage values mean there are greater imbalances in die. Depending on end applications, a die with a relative speed difference of 10 % or less is considered satisfactory. If end applications have tighter geometry tolerances, such as in automotive or aerospace, the limits are typically less than 3%. |
| Weld Strength Quality | The quality of the welding depends on many variables:
|
| Weld Surface | During extrusion of a hollow profile using bridge dies, the
billet splits and flows into the portholes before merging inside the
weld chamber. The surface formed when streams from neighboring
portholes merge is called the longitudinal seam weld.  The visualization of each surface region is shown in a different color. |