Examples#
Example 01 - Curves from Expression#
Create two curves from math expressions#
 1from hw import *
 2from hw.hg import *
 3import os
 4
 5ses = Session()
 6ses.new()
 7win=ses.get(Window)
 8win.type = 'xy'
 9
10exprXlist = ['0:1:0.0001','c1.x']
11exprYlist = ['sin(x*2*PI)','c1.y+0.2*sin(60*x*2*PI)']
12labelList = ['Basic Oscillation 1 HZ','Overtone 60 HZ']
13
14for exprX,exprY,label in  zip(exprXlist,exprYlist,labelList):
15        cu=CurveXY( xSource='math',
16                                xExpression= exprX,
17                                ySource='math',
18                                yExpression= exprY,
19                                label=label)
20
21win.update()
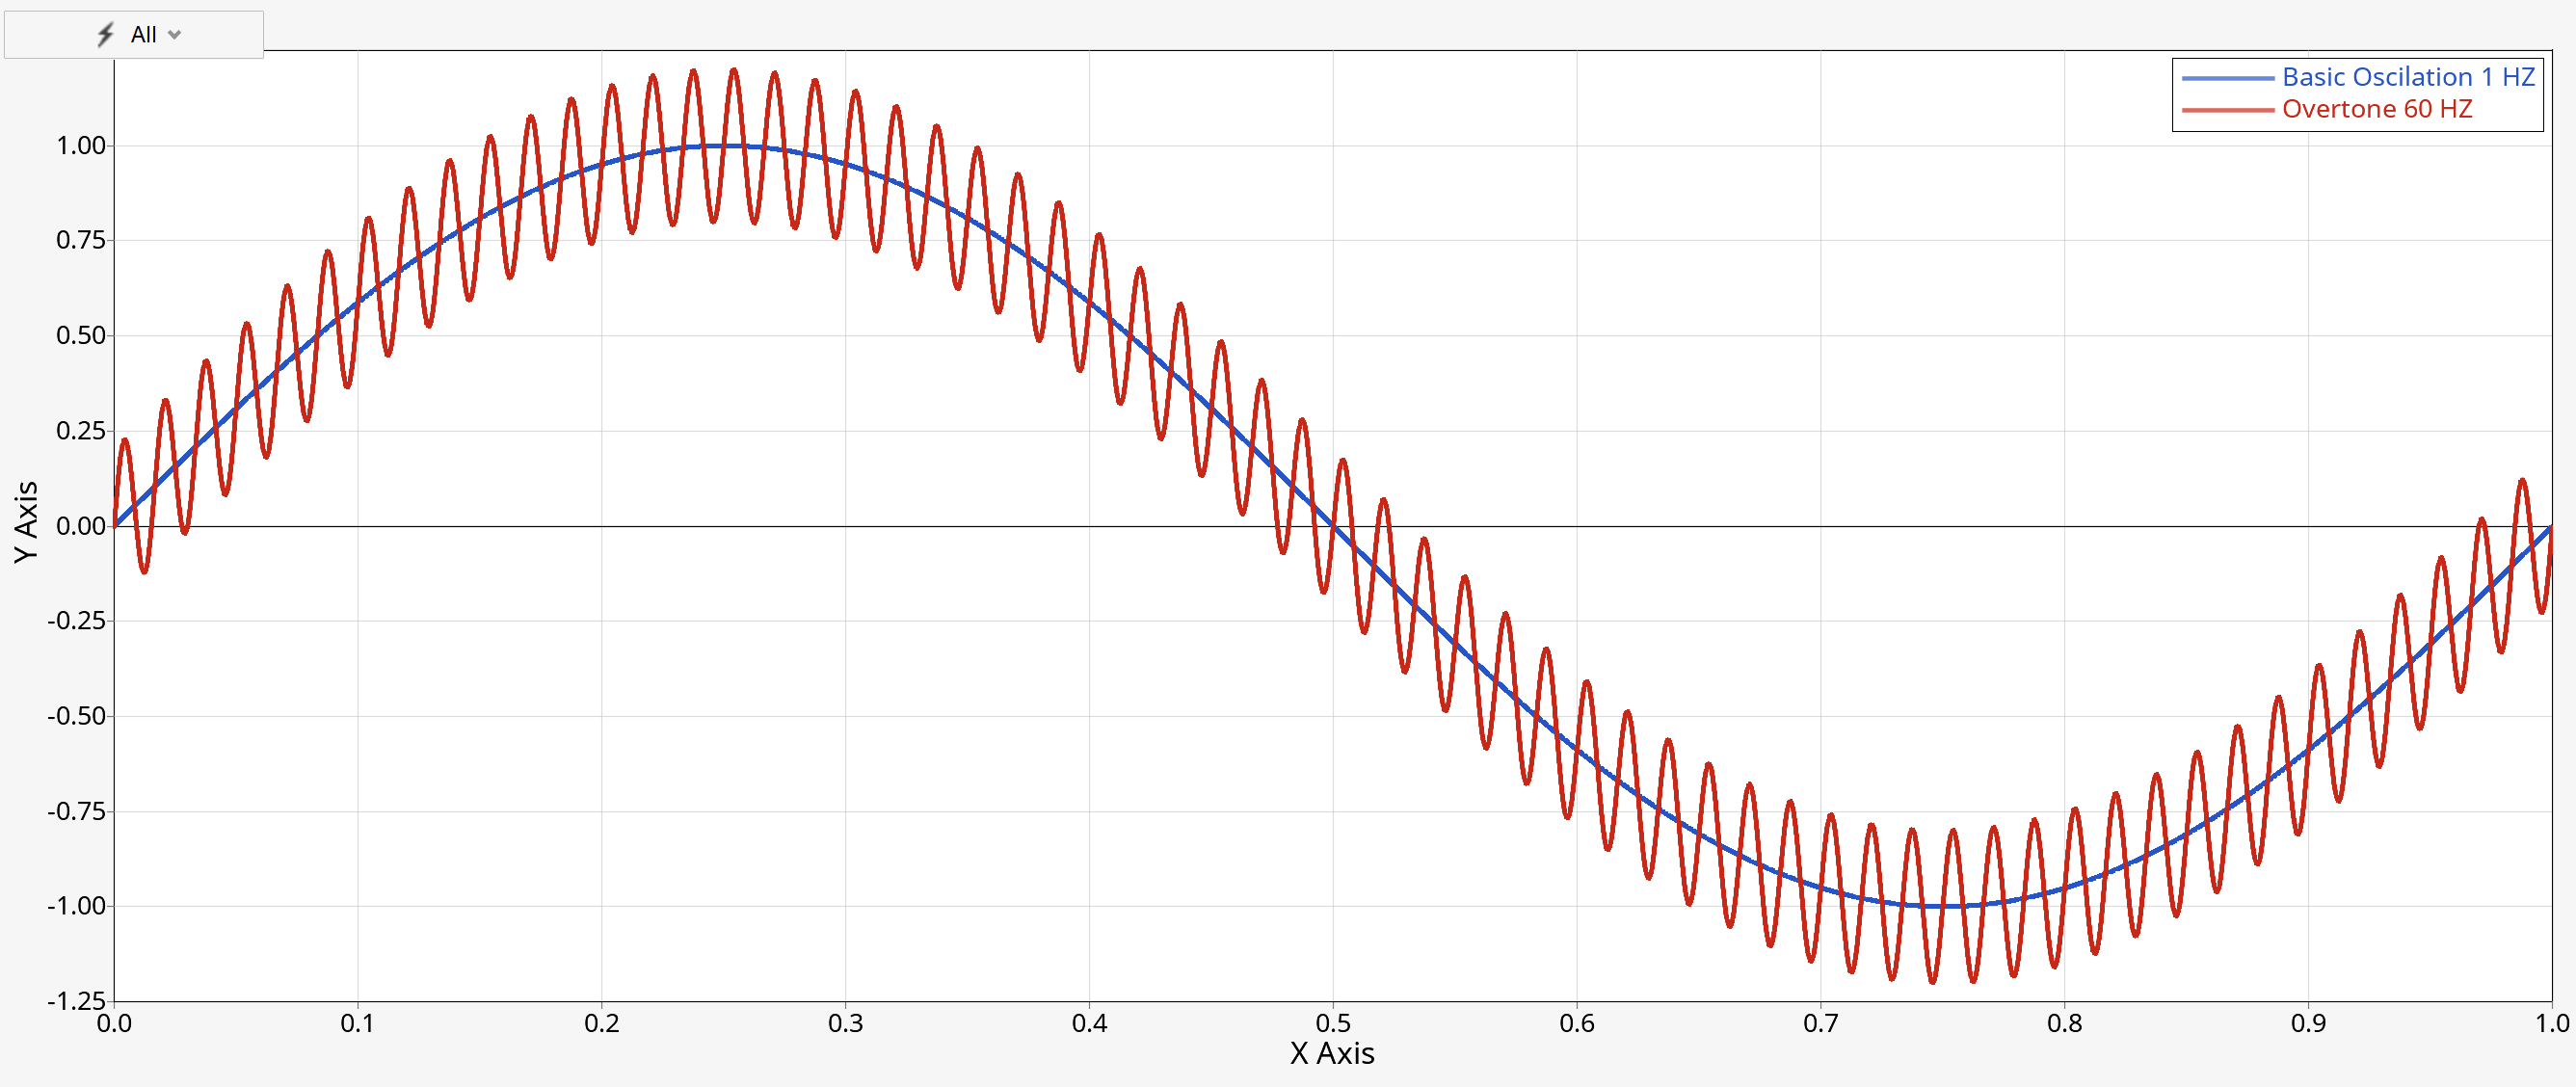
Figure 6. Output of ‘Create two curves from math expressions’
Example 02 - Curves from File#
Load two curves from file, define color and label#
 1from hw import *
 2from hw.hg import *
 3import os
 4
 5ALTAIR_HOME = os.path.abspath(os.environ['ALTAIR_HOME'])
 6plotFile    = os.path.join(ALTAIR_HOME,'demos','mv_hv_hg','plotting','madymo','ANGACC')
 7
 8ses = Session()
 9ses.new()
10win=ses.get(Window)
11win.type = 'xy'
12
13requestList = ['50th% Hybrid3   - LOWER TORSO','50th% Hybrid3   - UPPER TORSO']
14colorList=[(255,0,0),(0,0,255)]
15
16for color,request in  zip(colorList,requestList):
17        cu=CurveXY( xFile=plotFile,
18                        xSource='file',
19                        xDataType= 'Time',
20                        xRequest= 'Time',
21                        xComponent= 'Time',
22                        yFile=plotFile,
23                        ySource='file',
24                        yDataType= 'Angular Acceleration',
25                        yRequest= request,
26                        yComponent= 'Res. ang. acc.',
27                        lineColor=color,
28                        label='{y.HWRequest} - {y.HWComponent}')
29
30win.update()
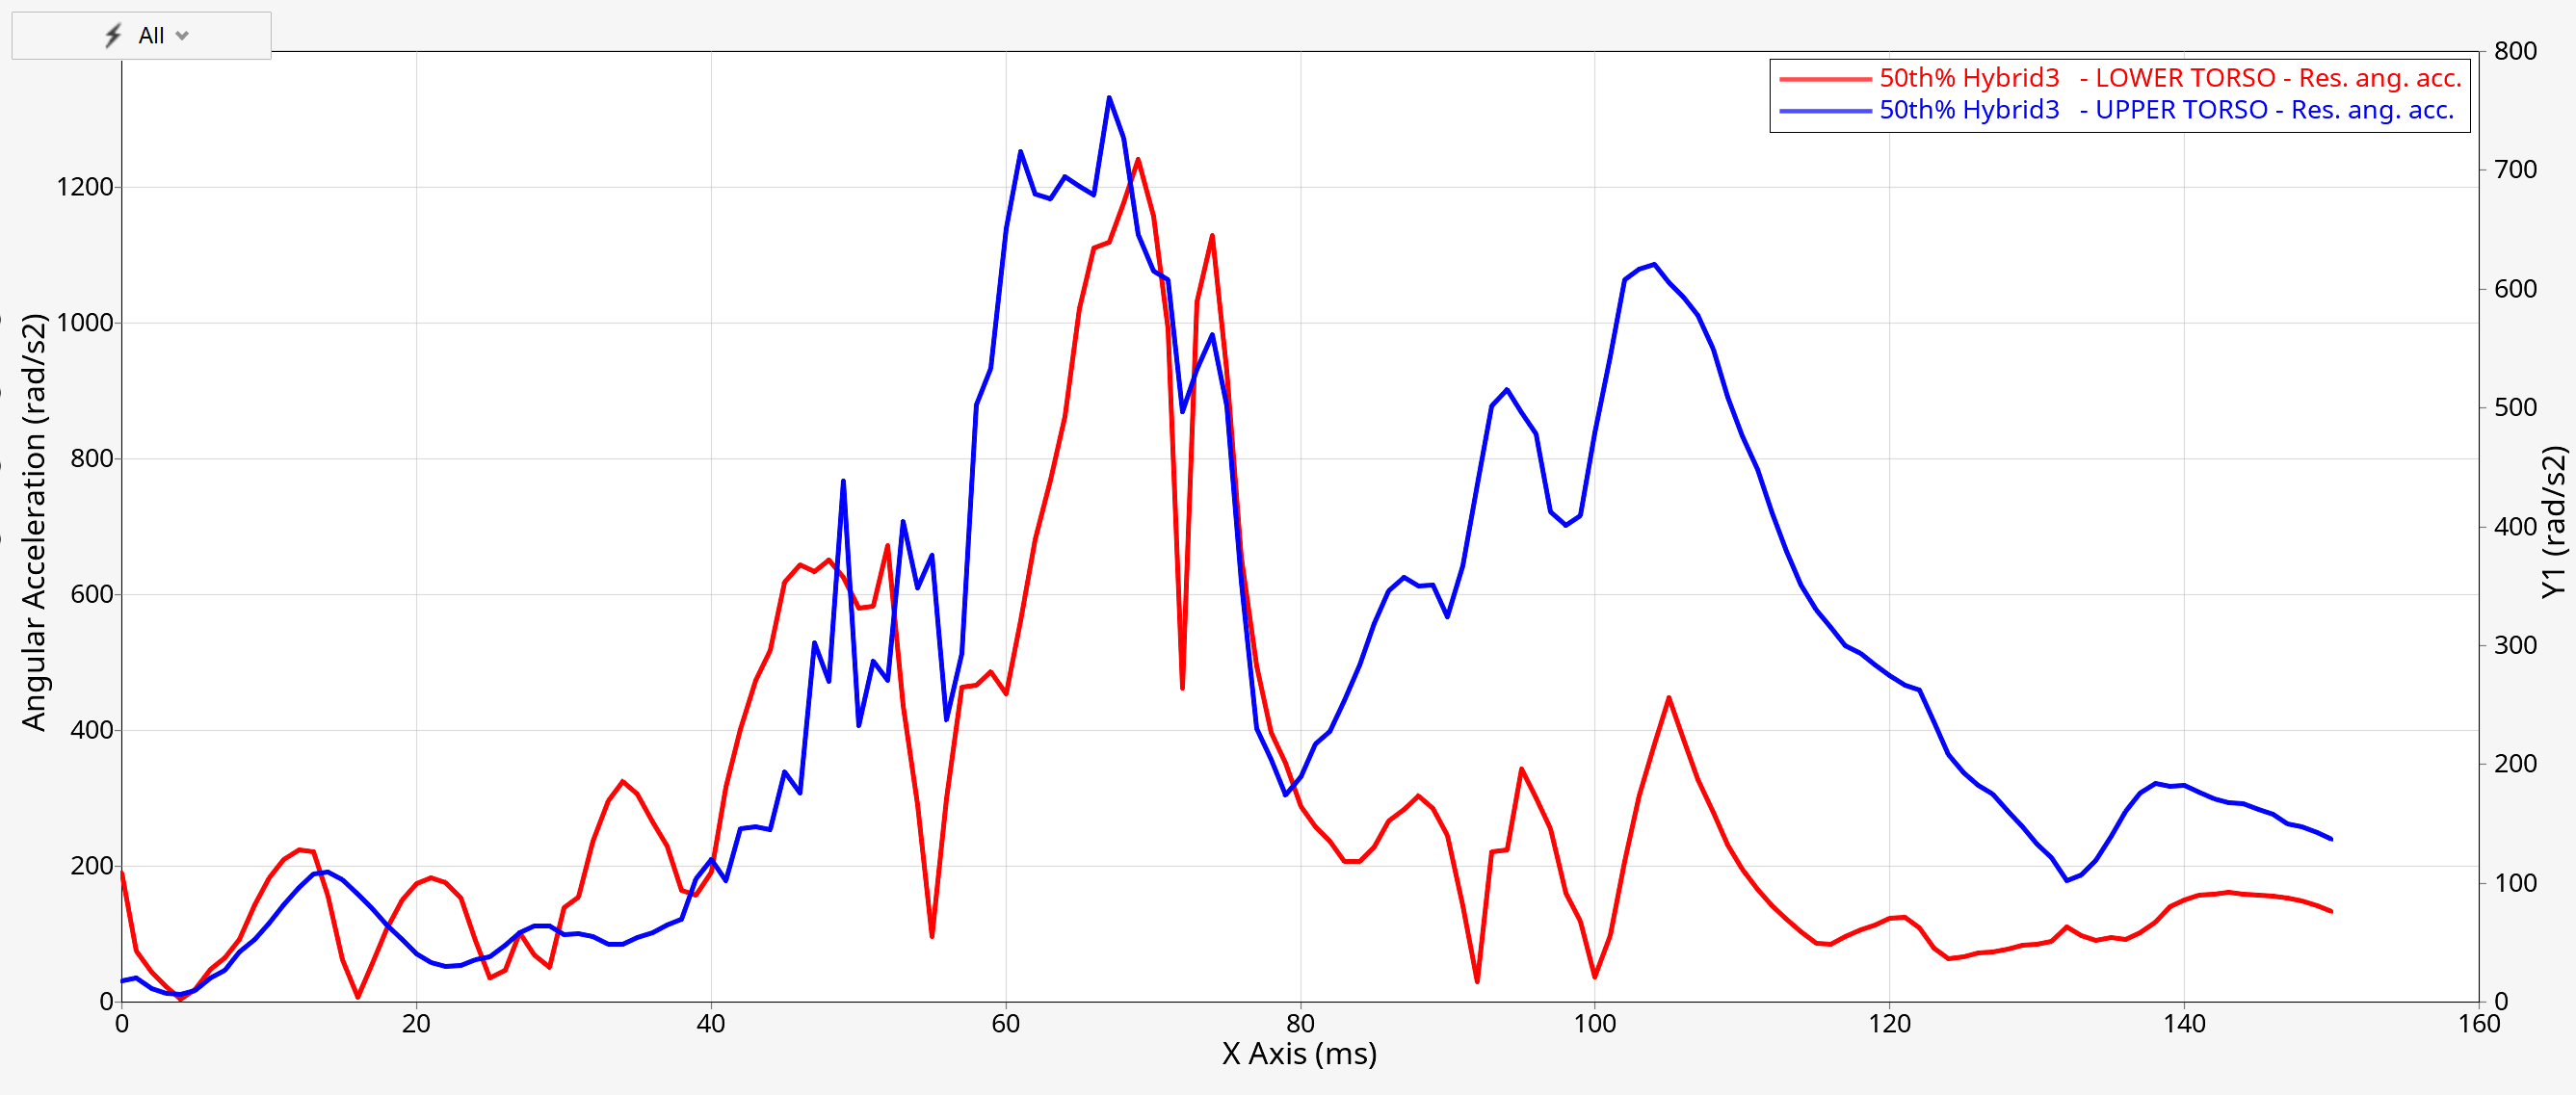
Figure 7. Output of ‘Load two curves from file, define color and label’
Example 03 - Curves from Files, Datums, Notes, Legends and PNG, XYDATA Export#
Load two curves, shade the area between, add notes and datums and export PNG#
 1from hw import *
 2from hw.hg import *
 3import os
 4
 5ALTAIR_HOME = os.path.abspath(os.environ['ALTAIR_HOME'])
 6plotFile    = os.path.join(ALTAIR_HOME,'demos','mv_hv_hg','plotting','madymo','ANGACC')
 7jpgFile     = os.path.join(os.path.abspath(os.path.dirname(__file__)) ,'HG_Image_Export.png')
 8xyDataFile  = os.path.join(os.path.abspath(os.path.dirname(__file__)) ,'HG_Curve_Export.xydata')
 9
10# New session
11ses = Session()
12ses.new()
13win=ses.get(Window)
14win.type = 'plot'
15
16# Define image and curve export tools
17captureImage = CaptureImageTool(file=jpgFile,type = 'png',width = 2000,height = 1000,)
18exportCurves = ExportCurves(file=xyDataFile,format='xyData',range='all')
19
20# Layout and channel settings
21colorList   = [(255,0,0),(0,0,255)]
22requestList = ['50th% Hybrid3   - LOWER TORSO','50th% Hybrid3   - UPPER TORSO']
23autoPosList = ['right','left']
24
25# Loop over curves, notes and datums
26for color,request,autoPos in  zip(colorList,requestList,autoPosList):
27
28        # Add curves
29        cu=CurveXY( xFile=plotFile,
30                        xSource='file',
31                        xDataType= 'Time',
32                        xRequest= 'Time',
33                        xComponent= 'Time',
34                        yFile=plotFile,
35                        ySource='file',
36                        yDataType= 'Angular Acceleration',
37                        yRequest= request,
38                        yComponent= 'Res. ang. acc.',
39                        lineColor=color,
40                        label='{y.HWRequest} - {y.HWComponent}')
41
42        # Add curve math
43        cu.mathAdd('SAE', padding=1, direction=1, filterClass=15)
44        cu.mathAdd('trim',start=20,end=130)
45
46        cuId = str(cu.id)
47
48        # Add note attached to curve math
49        no = Note(attachTo='curve',
50                attachmentCurve=cu.id,
51                attachmentPoint='indexofmax(c'+cuId+'.y)',
52                text='Max = {y} at {x}',
53                autoPosition=True,
54                autoPositionStrategy=autoPos,
55                curveColor=True)
56
57        # Add vertical datum
58        dv=DatumVertical(position='c'+cuId+'.x[indexofmax(c'+cuId+'.y)]',
59                        label='Max '+cu.yRequest,
60                        labelLocation='upperCenter',
61                        lineColor=color)
62
63# Modify legend
64legend = ses.get(Legend)
65legFont = Font(size = 14)
66legend.placement = 'insideRightBottomCorner'
67legend.font = legFont
68
69# Shade area between 2 curves
70cu.setAttributes(shadeArea= True,
71                        shadeStyle= 'betweenCurves',
72                        shadeSecondCurve= 1,
73                        shadeColor= 'Blue',
74                        shadeAlpha= 0.2)
75
76win.update()
77
78# Export image and modified curve values in XYDATA format
79captureImage.capture()
80exportCurves.export()
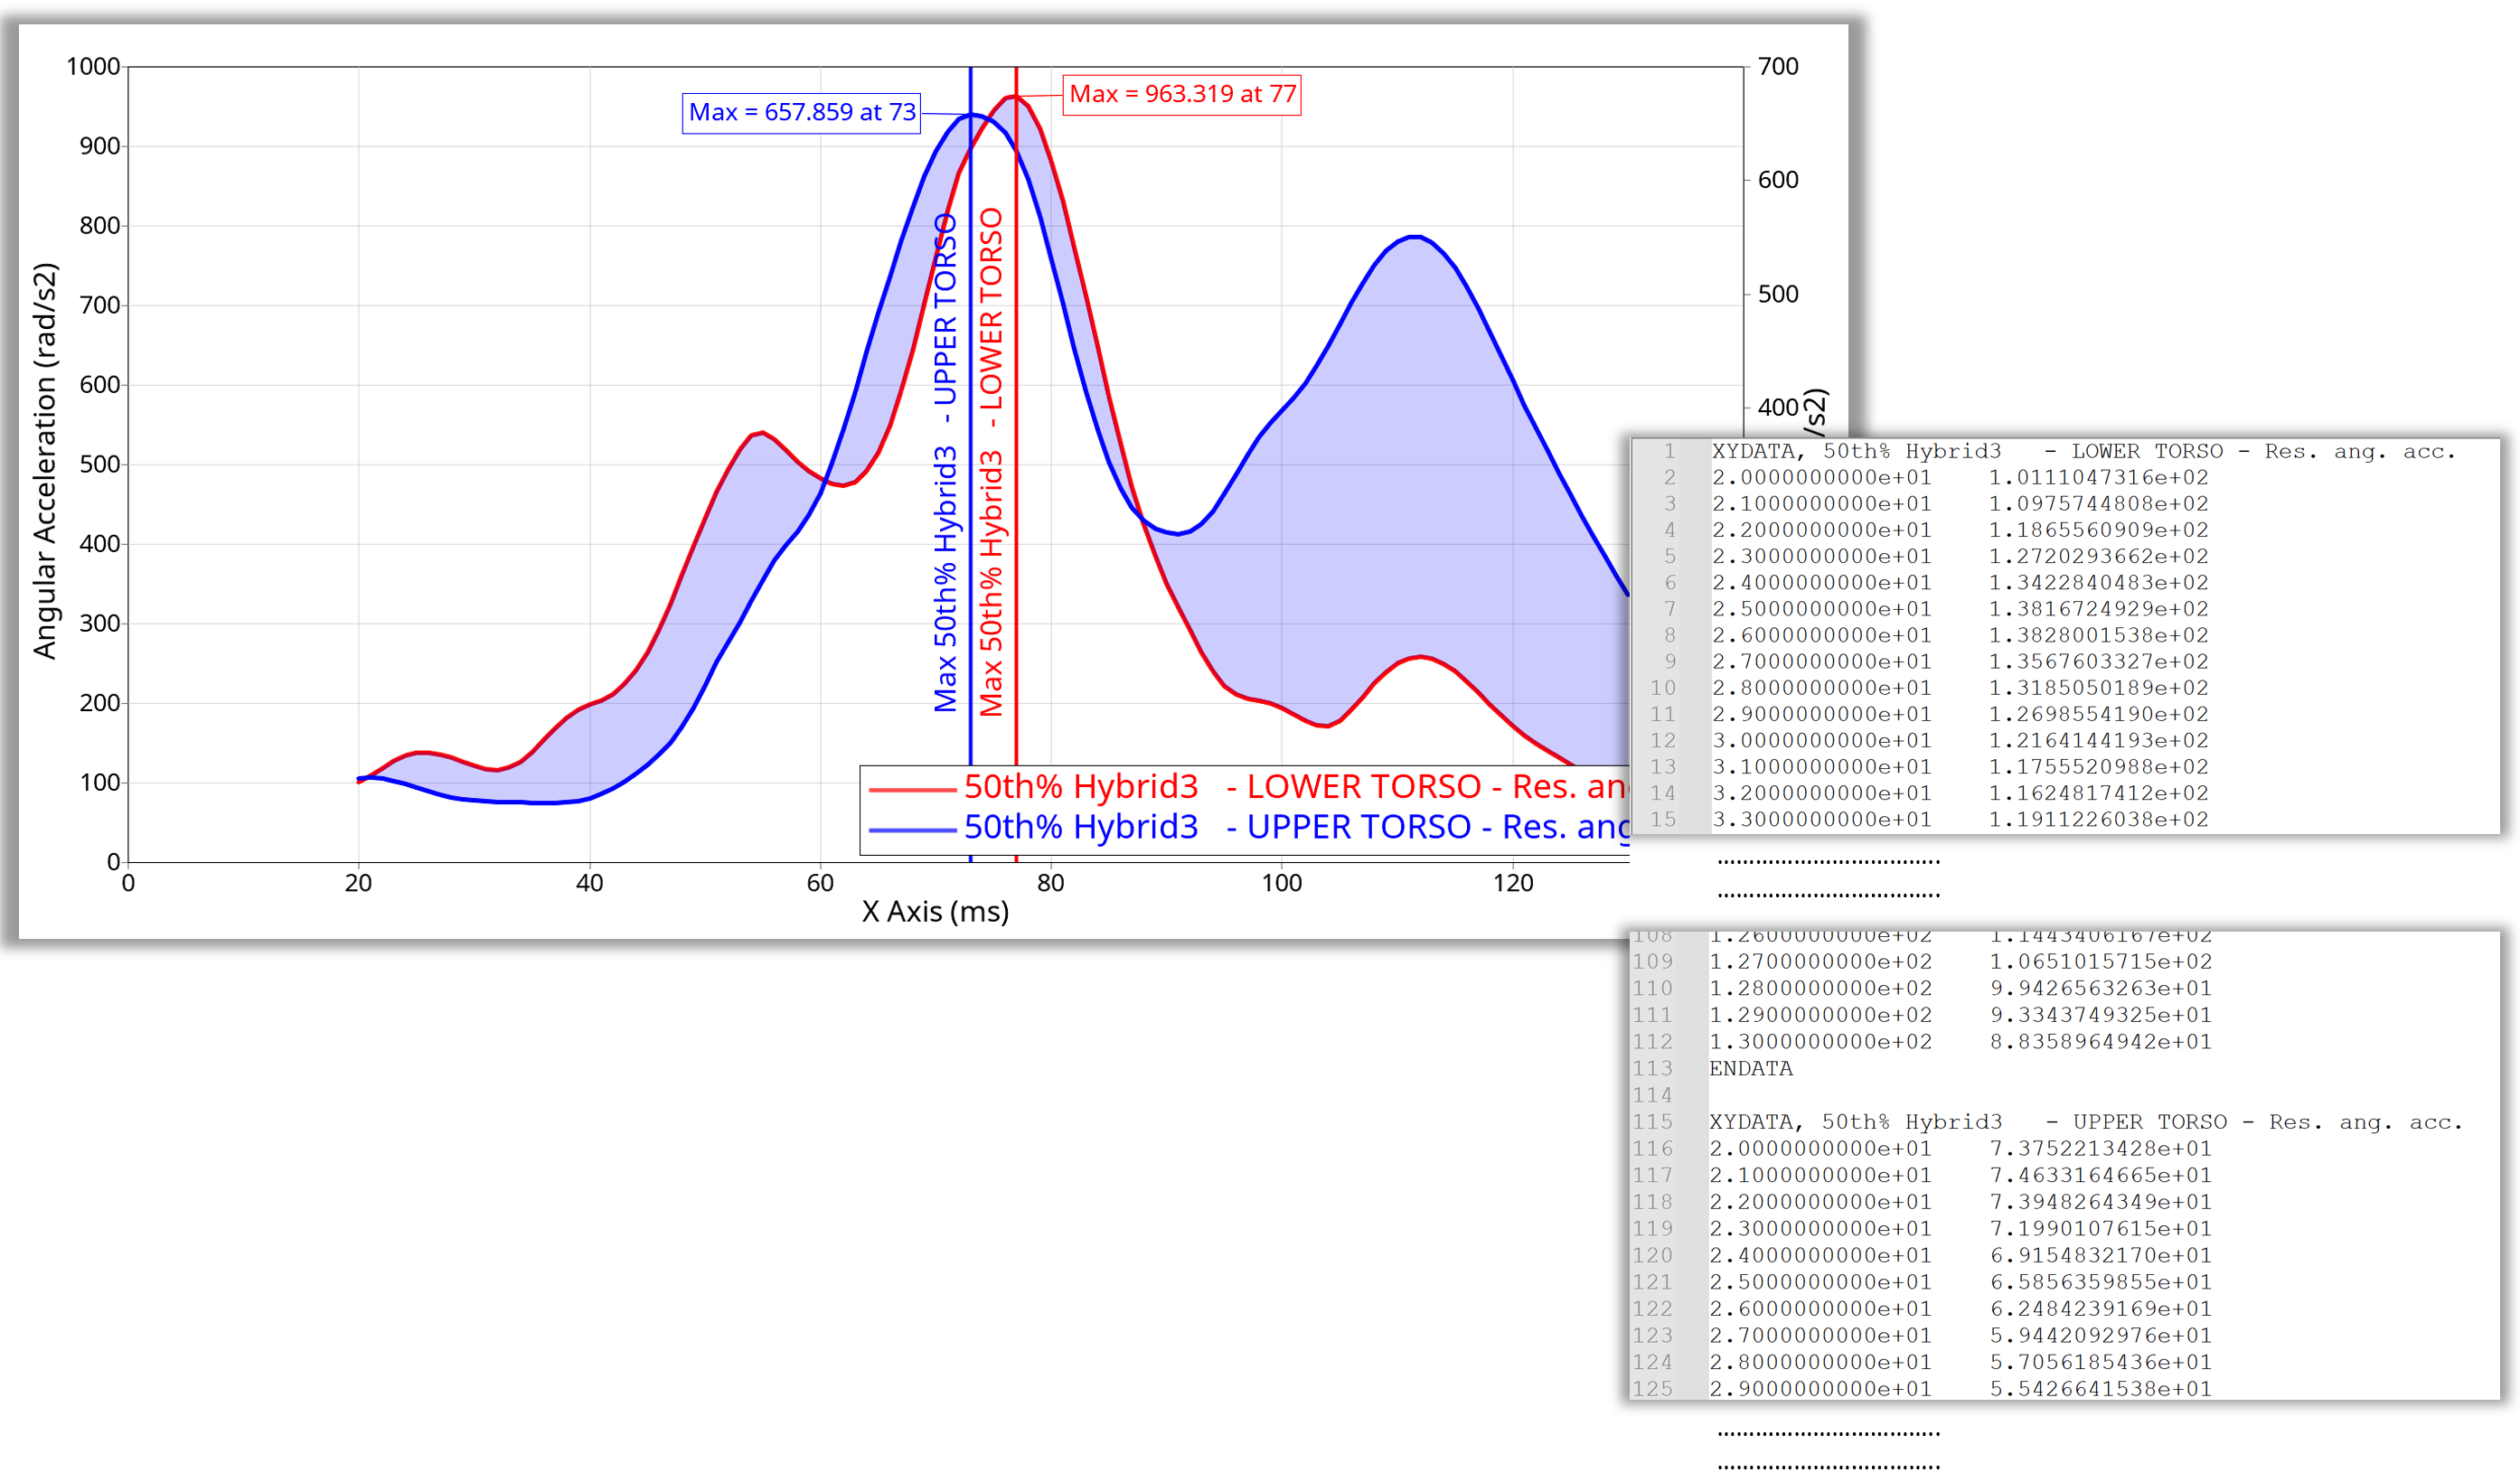
Figure 8. Exported Image of script ‘Curves from Files, Datums, Notes, Legends and PNG, XYDATA Export’
Example 04 - evalHWC() for Curve Import and Math Operations#
evalHWC() - Curve Import and Math Operations#
 1from hw import *
 2from hw.hg import *
 3import os
 4
 5src_path = os.path.dirname(os.path.abspath(__file__))
 6plotFile = os.path.join(src_path,'ANGACC')
 7
 8# New session
 9evalHWC('delete session')
10# Set Client Type to HyperGraph
11evalHWC('hwd window type=\"HyperGraph 2D\"')
12# Load curves with build plots module
13evalHWC('xy option layout destination=oneplotperrequest')
14evalHWC('xy option layout layout=1')
15evalHWC('xy load file='+plotFile+' ydatatype= \"Angular Acceleration\" \
16                        yrequest= \"50th% Hybrid3   - LOWER TORSO\" , \"50th% Hybrid3   - UPPER TORSO\" ycomponent= all')
17evalHWC('xy curve stackadd range="w:all i:all" operation=trim start=20 end=130 interpolate=false')
18# Add curve math for all curves in current plot
19evalHWC('xy curve stackadd range="w:all i:all" operation=SAE padding=1 samples=10 direction=3 filterClass=60')
20evalHWC('xy curve stackadd range="w:all i:all" operation=resample type="Resample Fixed Points" fixnum=100.0')
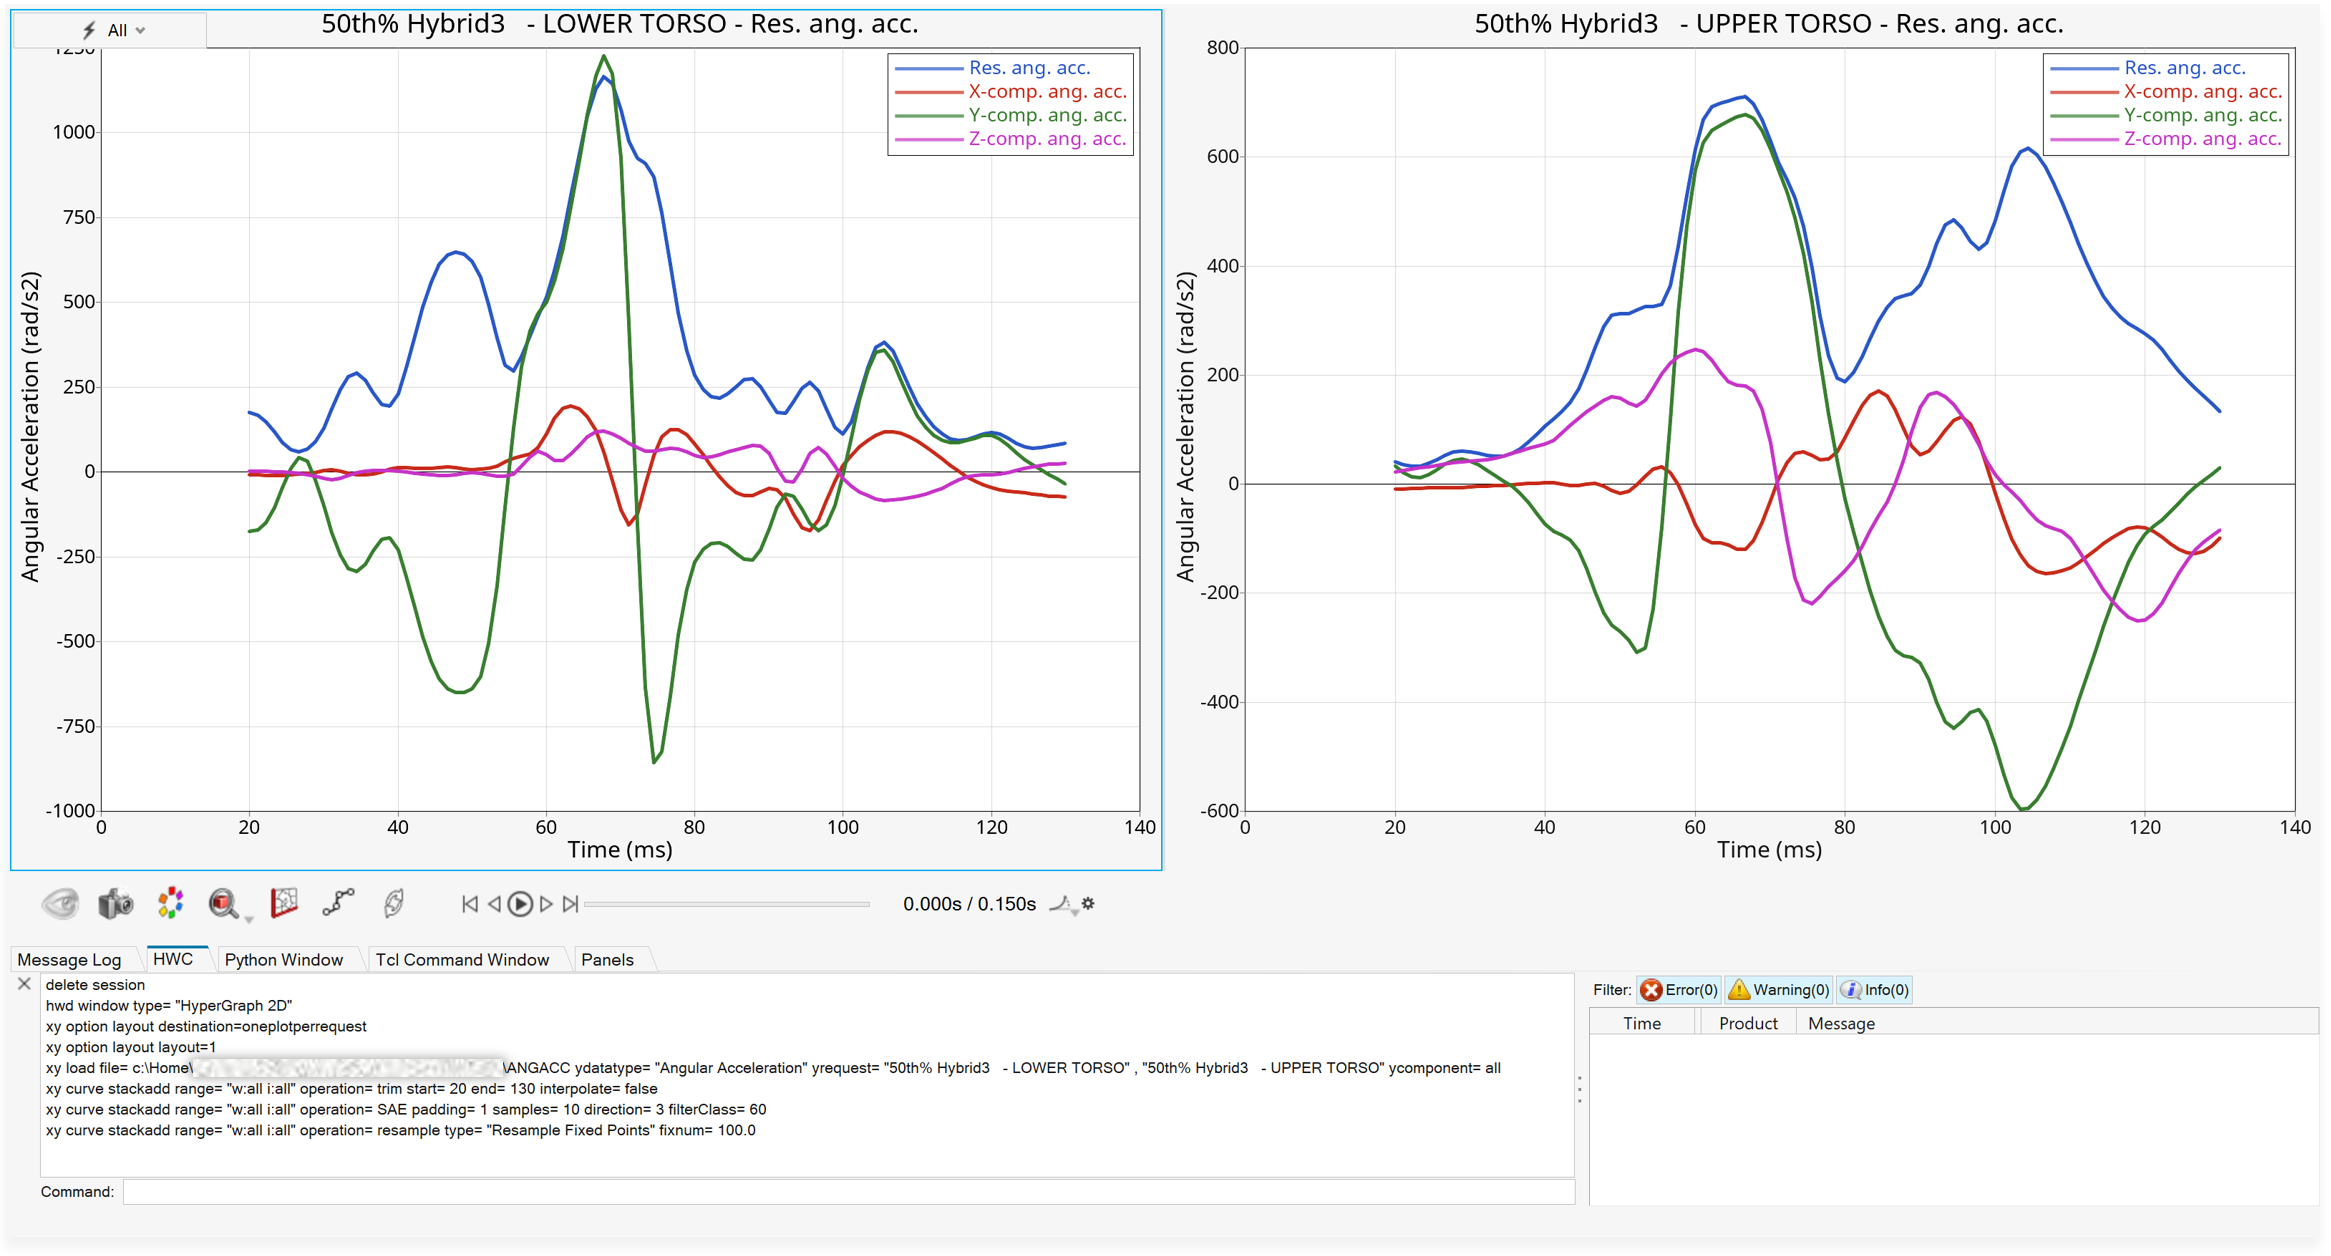
Figure 9. Output of ‘evalHWC() for Curve Import and Math Operations’
Example 05 - Create Multiple Plot Layout#
Create multiple pages from channel info stored in dictionary#
 1from hw import *
 2from hw.hg import *
 3import os
 4import itertools
 5
 6ALTAIR_HOME = os.path.abspath(os.environ['ALTAIR_HOME'])
 7plotFile    = os.path.join(ALTAIR_HOME,'demos','mv_hv_hg','plotting','madymo','ANGACC')
 8
 9# New Session
10ses = Session()
11ses.new()
12
13# Dictionary with curve channel names
14plotDict =  {
15                'yRequests'   : ['50th% Hybrid3   - LOWER TORSO','50th% Hybrid3   - UPPER TORSO', '50th% Hybrid3   - UPPER LEG RIGHT', '50th% Hybrid3   - UPPER LEG LEFT'],
16                'yComponents' : ['Res. ang. acc.',  'X-comp. ang. acc.', 'Y-comp. ang. acc.', 'Z-comp. ang. acc.'],
17                'lineColors'  : ['#ff0000',  '#00ff00', (0,0,255), (0,0,0)],
18        }
19
20# Create fonts and colors
21fontAxisText      = Font(family='Arial',style='regular',size=14)
22legendBorderColor = Color(rgb=(204, 204, 204))
23datumColor        = Color(hex='#ff0000')
24
25# Loop over pages
26for index in range(1,3):
27        ap =ses.get(Page)
28        if index > 1:
29                ap=Page()
30        ses.setActive(Page,id =index)
31
32        # Define page attributes
33        ap.setAttributes(layout=9, title='HG Demo ' + str(index))
34        i=0
35
36        # One plot per request
37        for request in plotDict.get('yRequests'):
38                i += 1
39                aw=ses.setActive(Window,window=i)
40                aw.type='xy'
41
42                # Add curves from dictionary
43                for (component,color) in zip(plotDict.get('yComponents'),plotDict.get('lineColors')):
44                        cu=CurveXY(
45                                xFile=plotFile,
46                                xType='file',
47                                xDataType= 'Time',
48                                xRequest= 'Time',
49                                xComponent= 'Time',
50                                yFile=plotFile,
51                                yType='file',
52                                yDataType= 'Angular Acceleration',
53                                yRequest= request,
54                                yComponent= component,
55                                lineColor=color,
56                                label='{y.HWRequest} - {y.HWComponent}')
57
58                        # Add curve math SAE filter
59                        cu.mathAdd('SAE', padding=1, direction=1, filterClass=15)
60
61                        # Create and Modify curve math trim operation
62                        mathTrim=cu.mathAdd('trim')
63                        mathTrim.setAttributes(start=20,end=140)
64
65                # Add vertical datum line at curve max
66                dv=DatumVertical(  position='c1.x[indexofmax(c1.y)]',
67                                        label='Y Max',
68                                        labelLocation='upperCenter',
69                                        lineColor = datumColor)
70
71                # Edit vertical axis label using font object
72                av=ses.get(AxisVertical,curve=cu)
73                av.text= 'Max of Resultant = {max(c1.y)}'
74                av.font=fontAxisText
75
76
77                # Modify Header values
78                header=ses.get(Header)
79                header.setAttributes( visibility=True,text='Demo Window '+str(i))
80
81                # Modify Legend Style
82
83                legend=ses.get(Legend)
84                legend.setAttributes(borderColor=legendBorderColor,
85                                        borderStyle=3,
86                                        placement='insideRightBottomCorner')
87
88                # Create note at maximum of curve 3
89                note = Note(   attachTo='curve',
90                                attachmentCurve=1,
91                                attachmentPoint='indexofmax(c1.y)',
92                                text='Max = {y} @ {x}',
93                                autoPosition=True,
94                                autoPositionStrategy='right',
95                                curveColor=True)
96
97                # Update() recalculates, fits and draws
98                aw.update()

Figure 10. Output of ‘Create Multiple Plot Layout’
Example 06 - Get Channel Info#
Get channel info from plot file#
 1from hw import *
 2from hw.hg import *
 3import os
 4
 5scriptDir   = os.path.abspath(os.path.dirname(__file__))
 6plotFile   = os.path.join(scriptDir,'plot','ANGACC')
 7
 8dtIndex=1
 9dataFile=DataFile(plotFile)
10dataTypeList=dataFile.getDataTypes()
11requestList=dataFile.getRequests(dataTypeList[dtIndex])
12componentList=dataFile.getComponents(dataTypeList[dtIndex])
13metaList=dataFile.getMetaDataList(dataTypeList[1],requestList[0],componentList[0])
14metaValue= dataFile.getMetaDataValue(dataTypeList[1],requestList[0],componentList[0],'HWUnit')
15
16print('Channel Info')
17print('File = '+plotFile)
18print('Reader Version = '+str(dataFile.readerVersion))
19print('Data Types')
20for dataType in dataTypeList: print('  '+dataType)
21print('Requests of DataType = '+dataTypeList[dtIndex])
22for request in requestList: print('    '+request)
23print('Components of DataType = '+dataTypeList[dtIndex])
24for component in componentList: print('      '+component)
25print('Meta Data Label = '+metaList[0])
26print('      Value = '+metaValue)
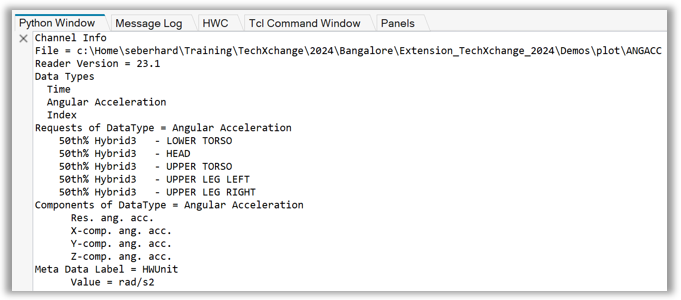
Figure 11. Console Output of ‘Get Channel Info’
Example 07 - Create Data Frames from Plot Files#
Create and plot NumPy and Pandas Data Frames#
 1from hw import *
 2from hw.hg import *
 3import os
 4import matplotlib.pyplot as plt
 5
 6scriptDir   = os.path.abspath(os.path.dirname(__file__))
 7plotFile   = os.path.join(scriptDir,'plot','ANGACC')
 8
 9dtIndex=1
10dataFile=DataFile(plotFile)
11dataTypeList=dataFile.getDataTypes()
12requestList=dataFile.getRequests(dataTypeList[dtIndex])
13componentList=dataFile.getComponents(dataTypeList[dtIndex])
14
15dataFileQuery=DataFileQuery(plotFile)
16dataFileQuery.dataType=dataTypeList[dtIndex]
17dataFileQuery.requests='all'
18dataFileQuery.components='all'
19dataFileQuery.includeTime=True
20
21print('Numpy Array')
22numpyArr=dataFileQuery.run('numpy')
23print(numpyArr)
24
25print()
26print('Plot Pandas Data Frame')
27pandasDataFrame=dataFileQuery.run('pandas')
28pandasDataFrame.plot(figsize=(25,20))
29plt.show()
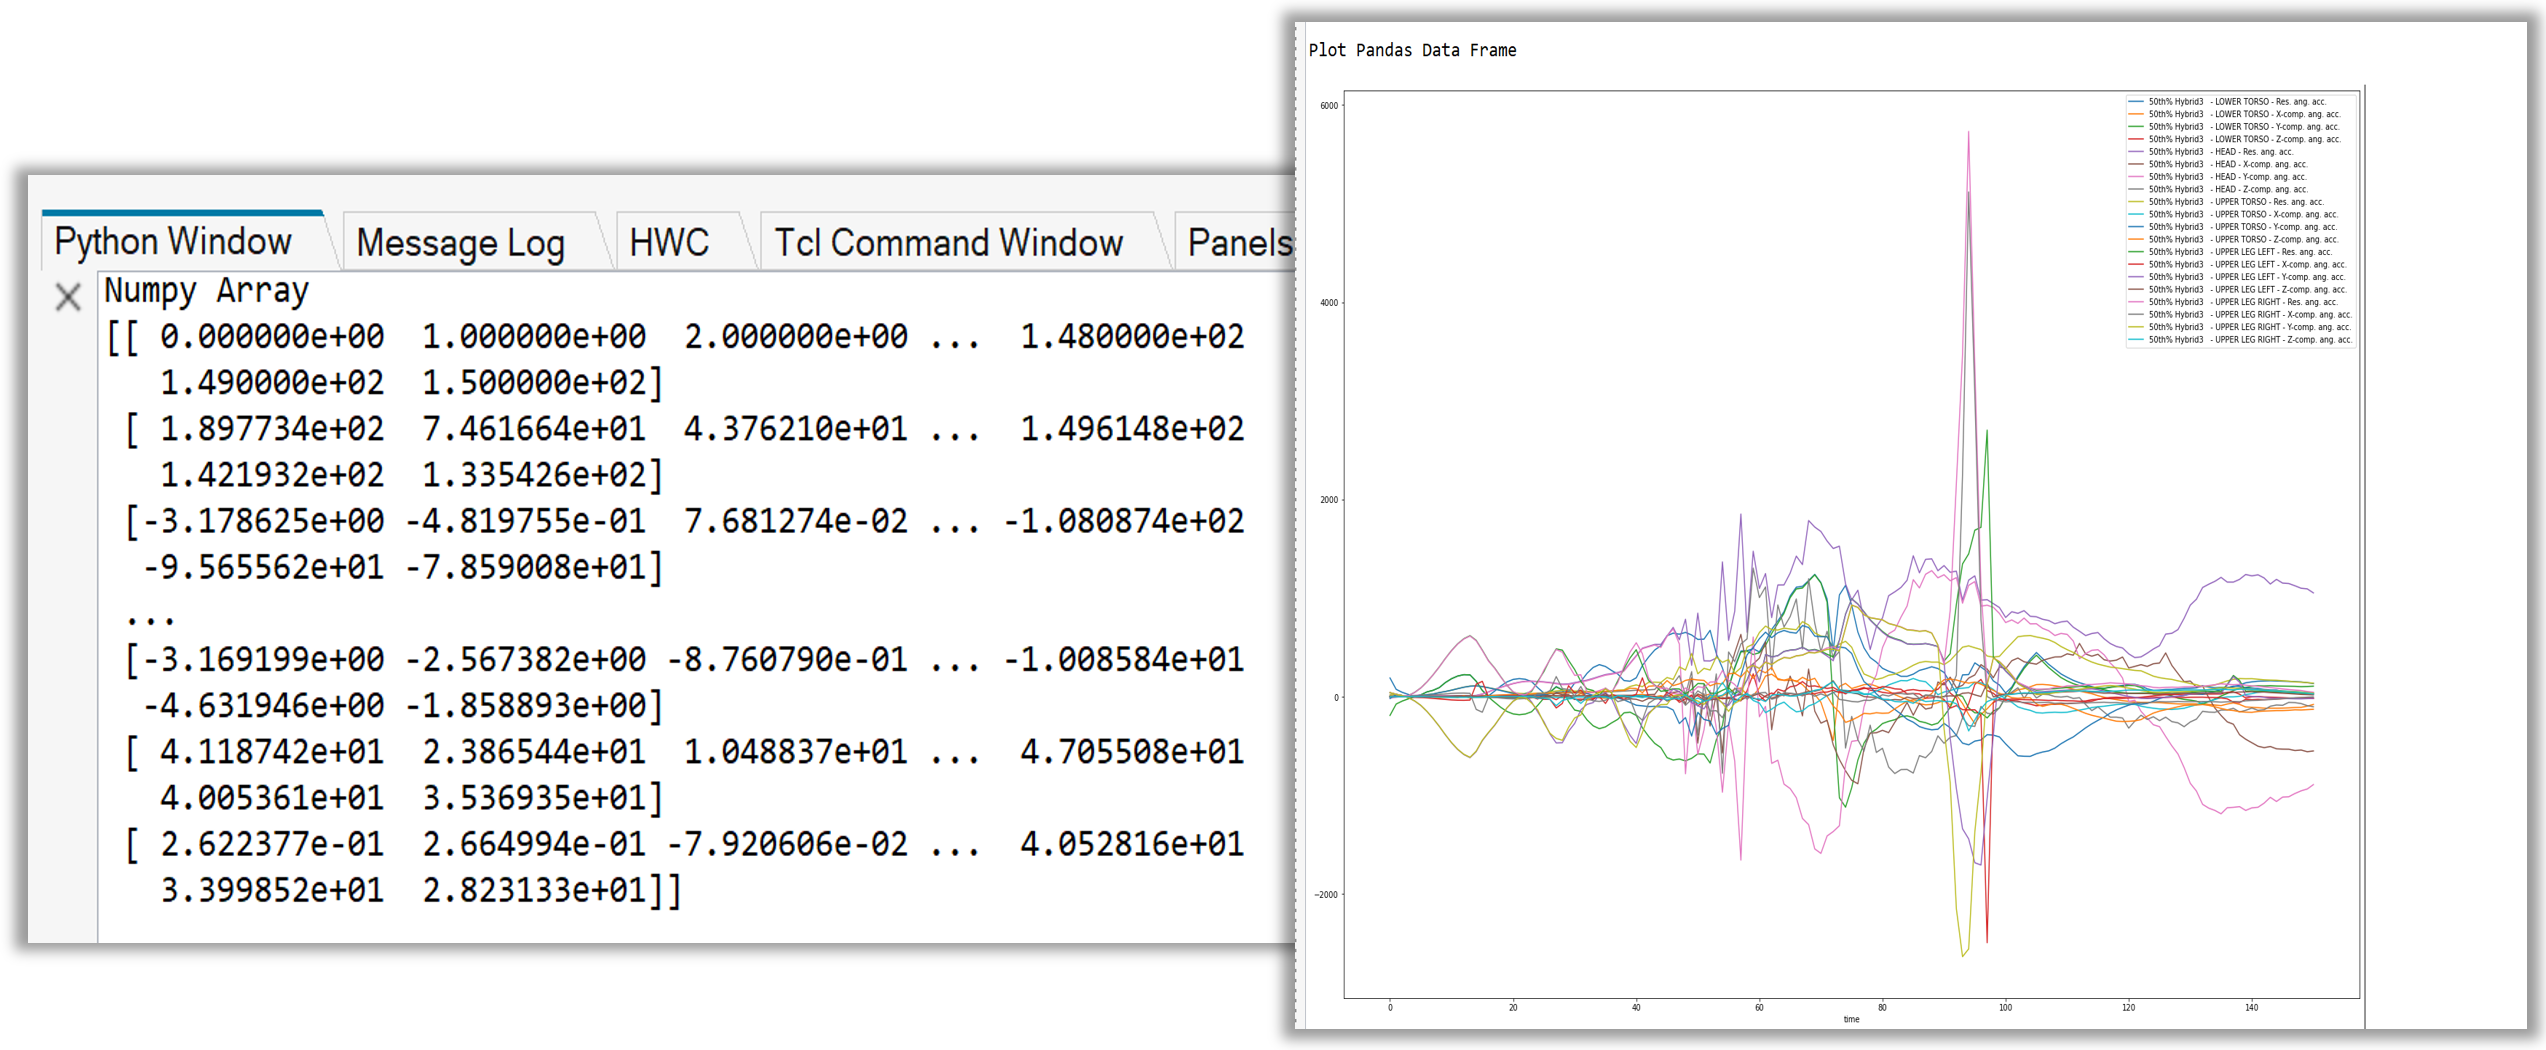
Figure 12. Console Output of ‘Create Data Frames from Plot Files’
Example 08 - Complex Curve#
Create and edit complex curves#
 1scriptDir   = os.path.abspath(os.path.dirname(__file__))
 2plotFile   = os.path.join(scriptDir,'plot','control_arm_sol111.pch')
 3
 4s=Session()
 5s.new()
 6# evalHWC('hwd window type="HyperGraph 2D"')
 7w=s.get(Window)
 8w.type="complex"
 9w.axisMode='ri'
10
11yrCompList = ['REL | X-Trans','REL | Y-Trans','REL | Z-Trans']
12yiCompList = ['IMG | X-Trans','IMG | Y-Trans','IMG | Z-Trans']
13colorList = ['#ff0000','#00ff00','#0000ff']
14
15for (yrComp,yiComp,color) in zip(yrCompList,yiCompList, colorList):
16        cu=CurveComplex(xFile=plotFile,
17                                        label=yrComp.split(' ')[-1],
18                                        xSource='file',
19                                        xDataType= 'Frequency [Hz]',
20                                        xRequest= 'Frequency [Hz',
21                                        xComponent= 'Frequency [Hz',
22                                        yrFile=plotFile,
23                                        yrSource='file',
24                                        yrDataType= 'Displacements',
25                                        yrRequest= 'Point id 2086',
26                                        yrComponent= yrComp,
27                                        yiFile=plotFile,
28                                        yiSource='file',
29                                        yiDataType= 'Displacements',
30                                        yiRequest= 'Point id 2086',
31                                        yiComponent= yiComp,
32                                        lineColor=color,
33                                        window=1,
34                                        page=1)
35
36cu.shadeArea=True
37cu.shadeStyle='betweenCurves'
38cu.shadeSecondCurve=2
39cu.shadeColor=(0,0,0)
40cu.shadeAlpha=0.2
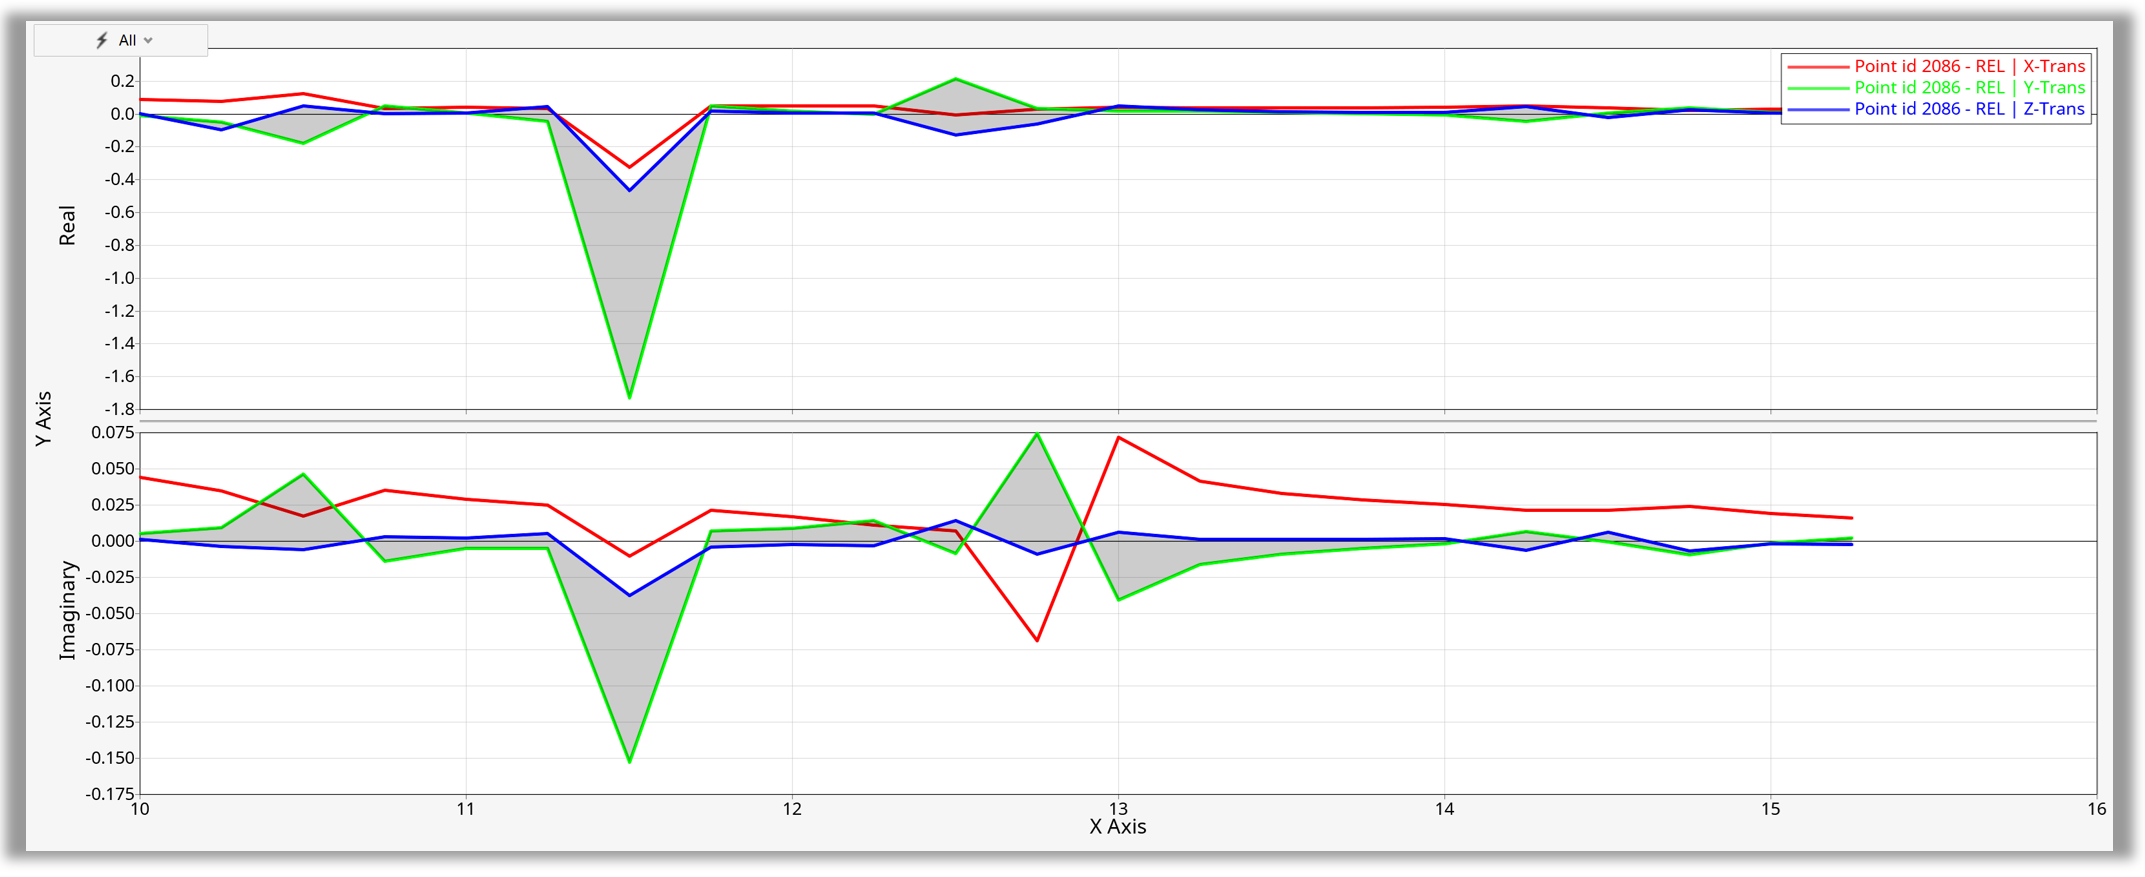
Figure 13. Complex Curve
Example 09 - Plotting Curves from Single File#
Advanced Build Plots functionality via Python#
 1from hw import *
 2from hw.hg import *
 3import os
 4
 5scriptDir   = os.path.abspath(os.path.dirname(__file__))
 6plotFile   = os.path.join(scriptDir,'plot','ANGACC')
 7
 8ses  = Session()
 9ses.new()
10# evalHWC('hwd window type="HyperGraph 2D"')
11win=ses.get(Window)
12win.type="xy"
13
14dataTypeList=['Time', 'Angular Acceleration', 'Index']
15dataType=dataTypeList[1]
16
17createCurves=CreateCurvesByFile()
18createCurves.file = plotFile
19createCurves.yDataType=dataType
20createCurves.yRequest='all'
21createCurves.yComponent='all'
22createCurves.layoutType=1
23createCurves.layoutOrganisation='onePlotPerRequest'
24createCurves.run()
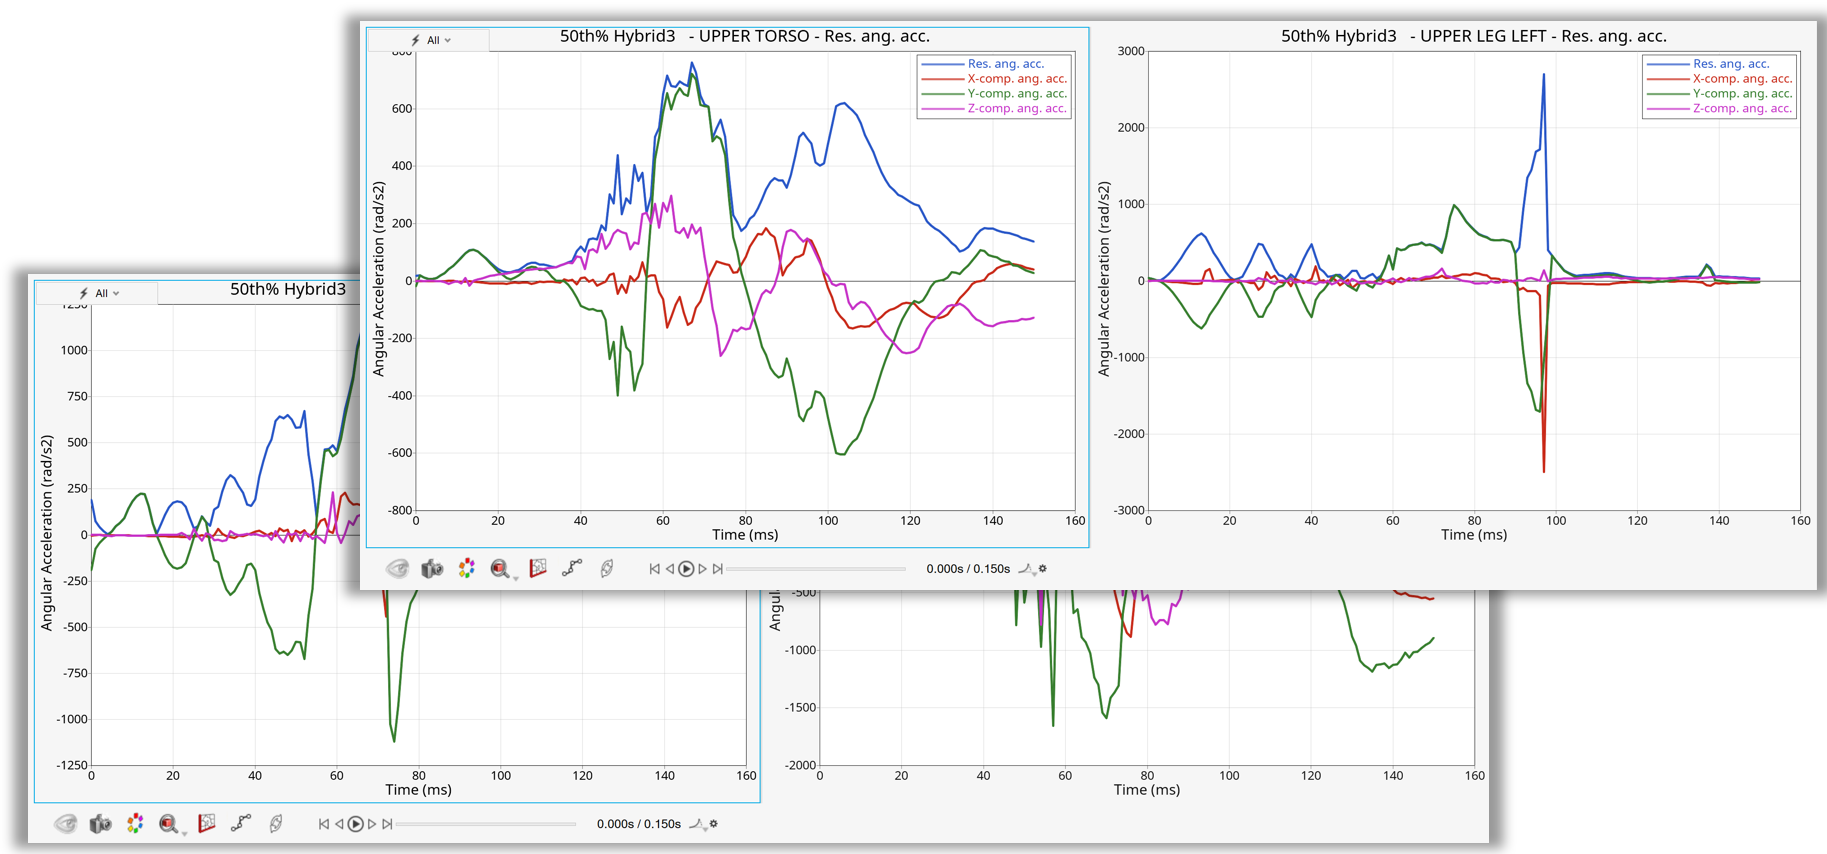
Figure 14. Plotting Curves from Single File
Example 10 - Plotting Curves from Multiple Files#
Advanced Build Plots functionality for plotting from multiple files#
 1from hw import *
 2from hw.hg import *
 3import os
 4
 5scriptDir   = os.path.abspath(os.path.dirname(__file__))
 6multipleFileDir   = os.path.join(scriptDir,'doe_1')
 7plotFile = os.path.join(scriptDir,'doe_1','run__00001','m_1','boxbeamT01')
 8
 9ses  = Session()
10ses.new()
11win=ses.get(Window)
12win.type="xy"
13
14dtIndex=1
15dataFile=DataFile(plotFile)
16dataTypeList=dataFile.getDataTypes()
17requestList=dataFile.getRequests(dataTypeList[dtIndex])
18componentList=dataFile.getComponents(dataTypeList[dtIndex])
19
20multipleFiles = MultipleFiles()
21multipleFiles.name='FS1'
22multipleFiles.directory='c:/Home/seberhard/Projects/Python/models/Plot/doe_1'
23multipleFiles.fileList=['run__00001/m_1/boxbeamT01',
24                                                'run__00002/m_1/boxbeamT01',
25                                                'run__00003/m_1/boxbeamT01',
26                                                'run__00004/m_1/boxbeamT01']
27multipleFiles.labelPrefixSuffix='dir2'
28multipleFiles.typePrefixSuffix='prefix'
29fileSet=multipleFiles.createFileSet()
30
31createCurves=CreateCurvesByFile()
32
33createCurves.file = multipleFiles
34
35createCurves.yDataType=dataTypeList[1]
36createCurves.yRequest=requestList[0:2]
37createCurves.yComponent=componentList
38createCurves.layoutType=1
39createCurves.layoutOrganisation='onePlotPerRequest'
40createCurves.run()
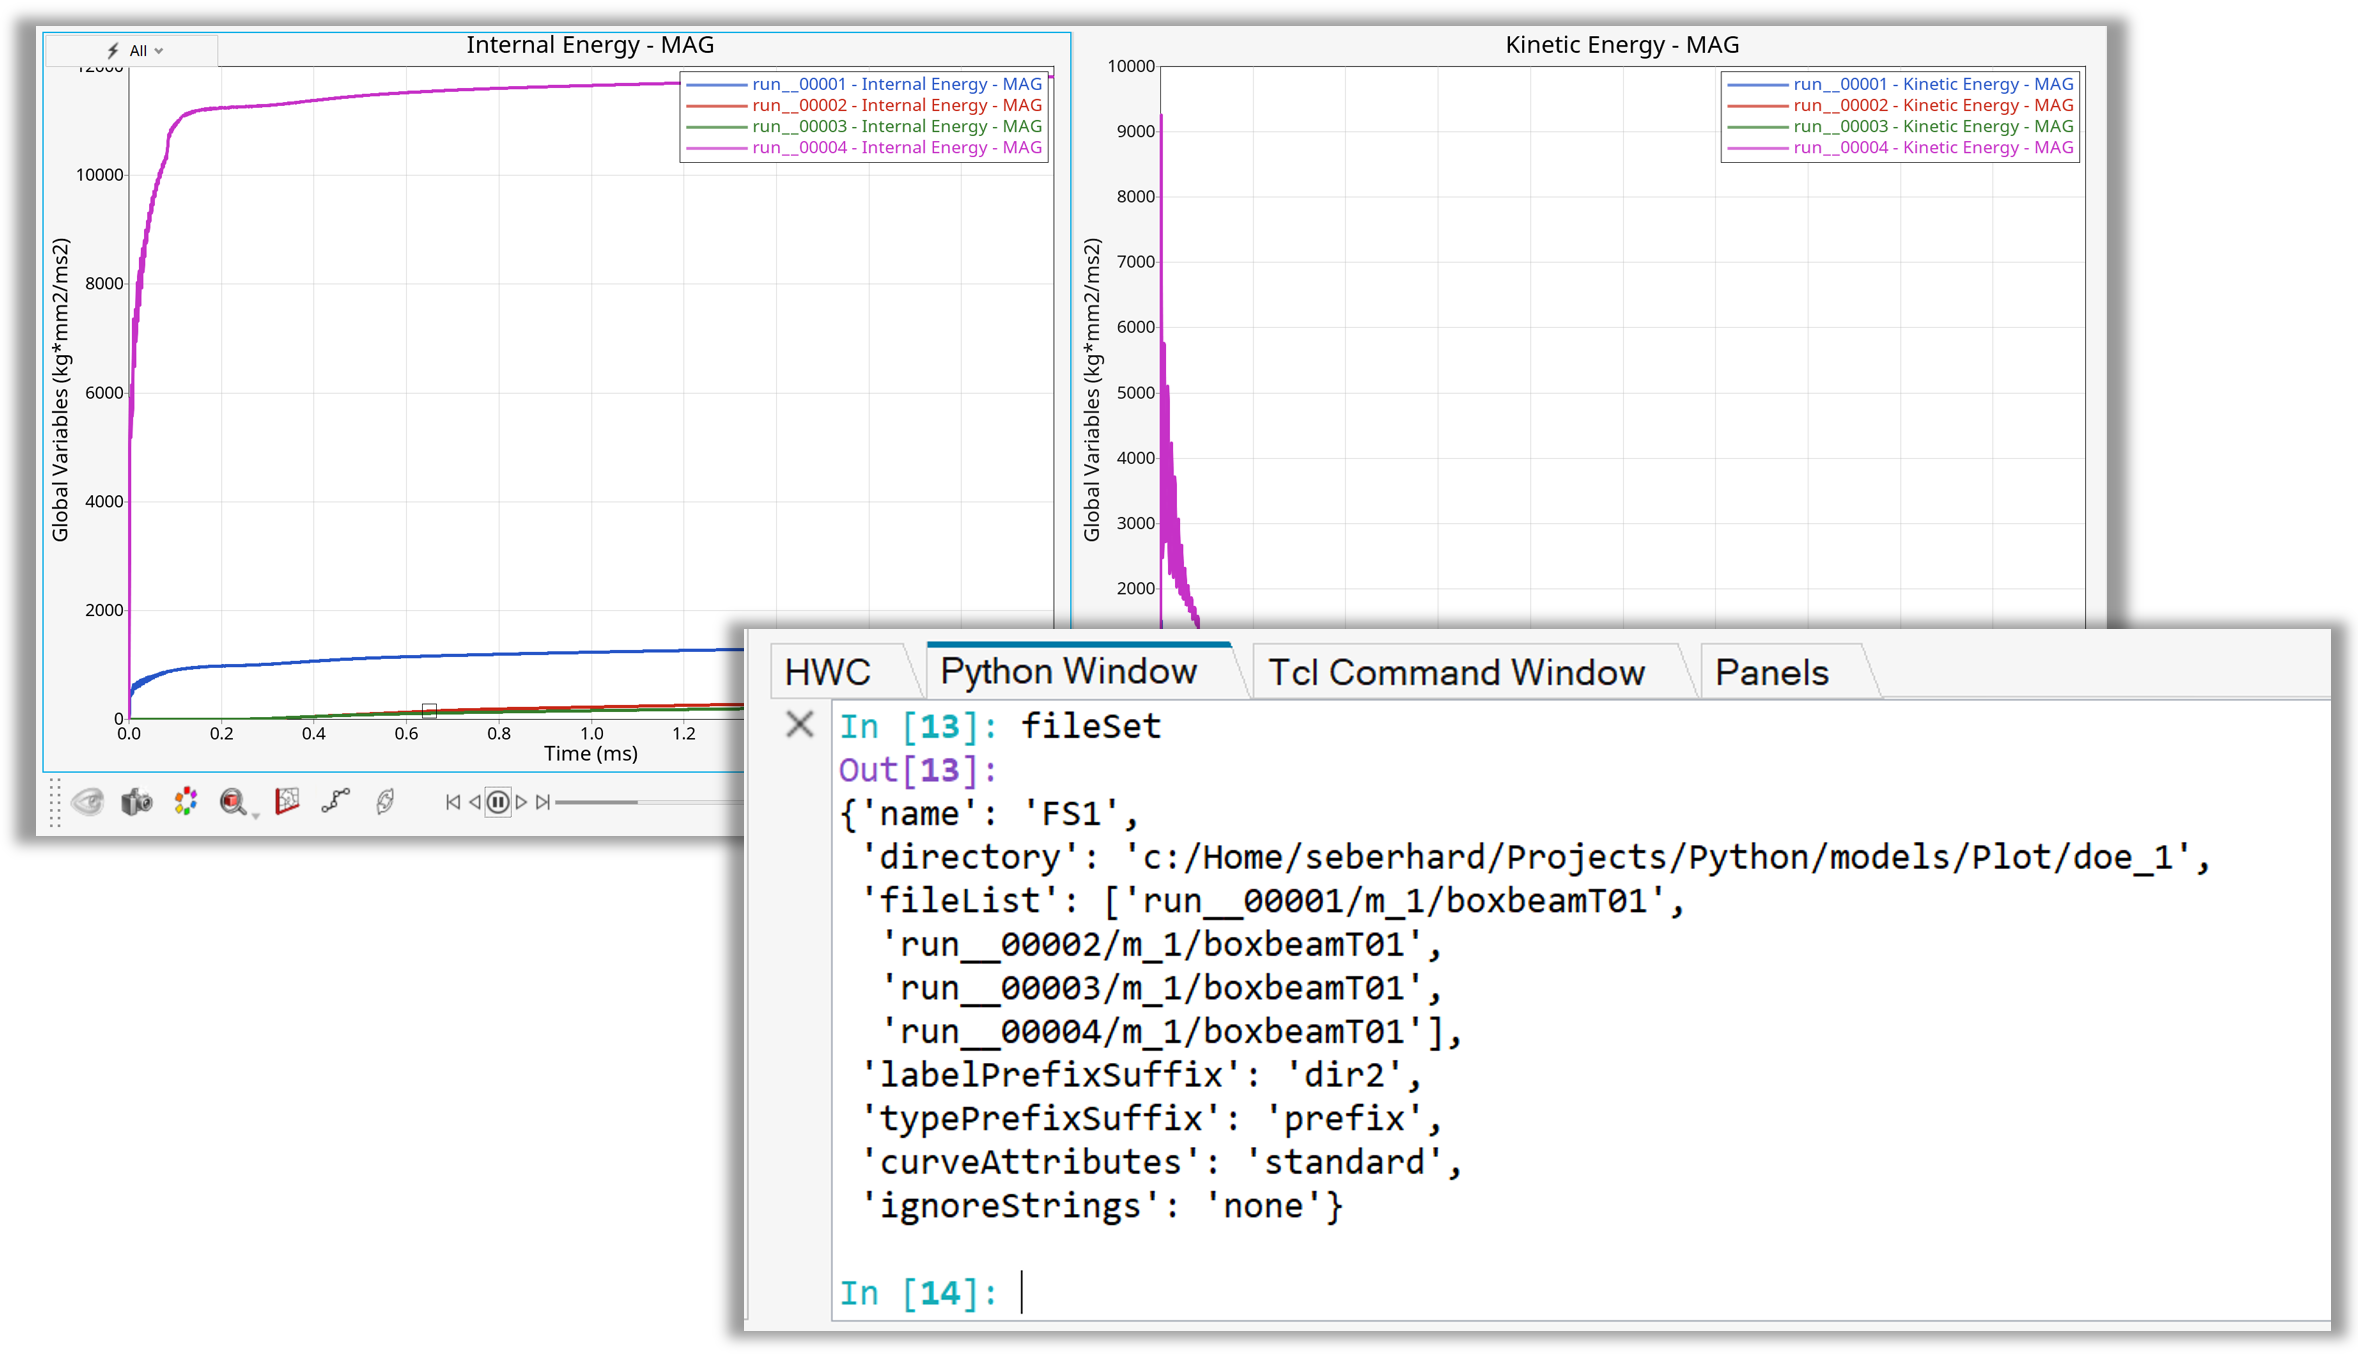
Figure 15. Plotting Curves from Multiple Files