|
»Click here to display Table of Contents«
|

XY Plot Option |

|

|

|

|
|
XY Plot Option |
|
|
|

|
|
»Click here to display Table of Contents«
|
XY Plot Option |
|
|
|
|
|
XY Plot Option |
|
|
|
|
This panel offers plotting or extraction of a solution component sampled along a user-specified line segment. Three data items specify how the sampling is performed. One is the currently active component, which is not shown on the XY Plot Editor panel; it does appear on the Isosurfaces Editor panel next to the Color by option. The other two items are the endpoints of the line segment, which are supplied in XY Plot Editor by typing in the (X1, Y1, Z1) and (X2, Y2, Z2) fields. After typing in the endpoints and selecting among the options described below, click Apply to generate an xy-plot of the extracted data in a new viewport. On this plot, the horizontal axis will be a measure of the distance along the segment connecting the endpoints, and the vertical axis will be the magnitude of the active component.
Field |
Description |
Component |
What solution component to plot on the y-axis. |
X-Axis |
The horizontal axis to use when creating the xy-plot and printing the extracted data to an output file. Options include S (arc length) and X, Y, or Z. |
Title |
Title for the plot. |
Options |
Displays plotting options for Axis, Markers, and Grid |
X1, Y1, Z1 |
The starting point for the line segment. |
X2, Y2, Z2 |
The end point for the line segment. |
Trace |
Toggles on and off a trace of the specified line segment. |
Export Data to file |
Writes the pointwise xy-plot data to a file, or to stdout if no file name is specified. |
Browse |
Browses files in the directory. |
Filename |
The file name to which the xy-data or the postscript hardcopy will be written. |
Save PS |
Saves a file with a PostScript hardcopy of the plot. |
Apply |
Activates the xy-plot options and writes to file. |
Dismiss |
Dismisses the panel. |
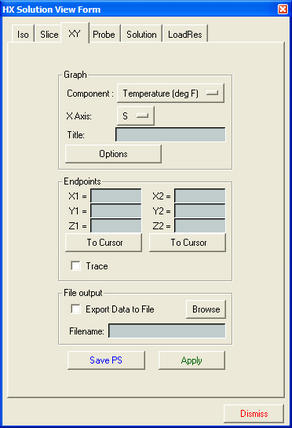
The XY-Plot Editor panel