Safety factor is calculated based on the endurance limit or target stress (at target
life) against the stress amplitude from the working stress history.
HyperLife calculates this ratio via two criteria:
Mean Stress = Constant
Stress Ratio = Constant
The safety factor (SF) based on the mean stress correction applied is given by the
following equations.
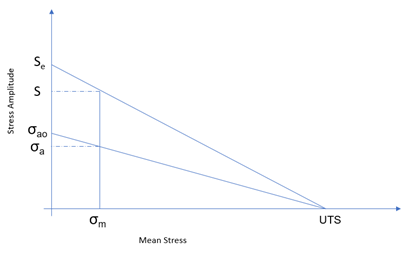
Mean Stress = Constant
Goodman or Soderberg
When SN curve is of the Stress Ratio R =
-1
= Target stress amplitude
against the target life from the modified SN curve
= Stress amplitude after mean
stress correction
Figure 1.
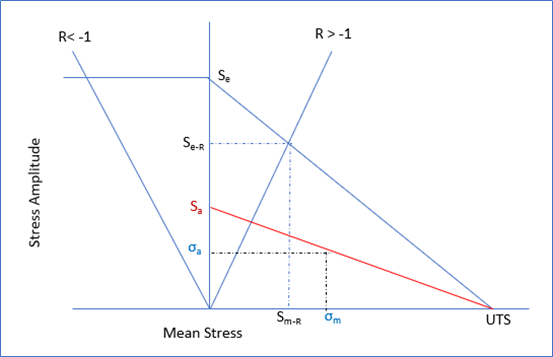
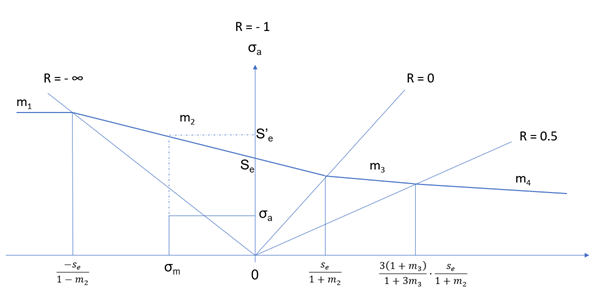
When SN curve is of the Stress Ratio R != -1Figure 2.
= Stress Amplitude
= Mean Stress
= Endurance limit obtained from
SN curve with R ratio
= Mean Stress corresponding to
If ,
If ,
If ,
If ,
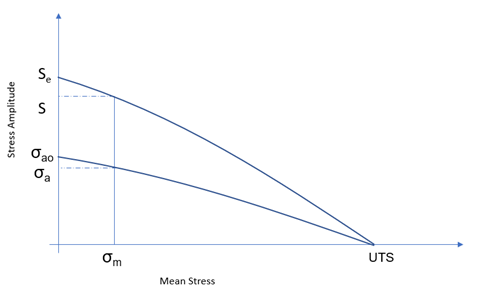
Gerber
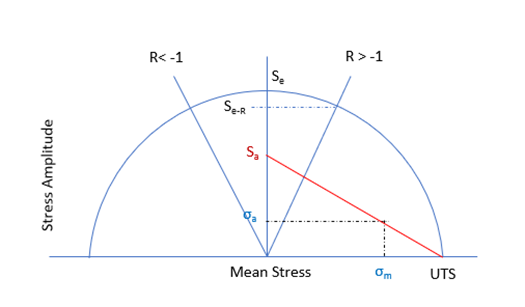
Figure 3. When SN curve is of the Stress Ratio R != -1Figure 4.
Gerber2
When SN curve is of the Stress Ratio R != -1
If
If ,
If ,
If ,
FKM
Figure 5.
No Mean Stress Correction
Stress Ratio = Constant
Goodman
When SN curve is of the Stress Ratio R = -1
Figure 6.
When SN curve is of the Stress Ratio R != -1
If ,
If ,
If ,
If ,
Gerber
When SN curve is of the Stress Ratio R = -1
When SN curve is of the Stress Ratio R != -1
If ,
If ,
Gerber2
When SN curve is of the Stress Ratio R != -1
If
If ,
If ,
If ,
FKM
= Corrected Stress Amplitude in
Constant R mean stress correction
No Mean Stress Correction
Interpolate
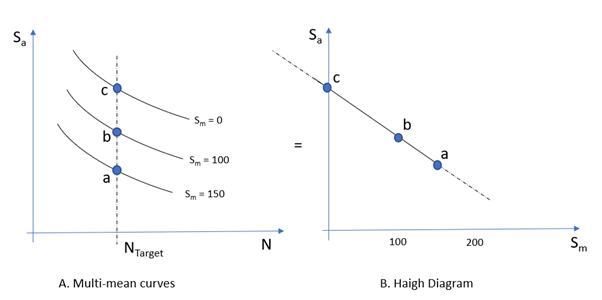
Safety Factor with Multi-Mean
To calculate safety factor, HyperLife creates an internal
Haigh diagram for the target life using multi-mean SN
curve by finding stress amplitude-mean stress pairs at
the target life. Using the internally created Haigh
diagram, HyperLife
calculates safety factor as described in section Safety
Factor in Chapter Haigh diagram. The number of data
points of the Haigh diagram is the number of curves.
Thus the more number of curves, the better result. When
Haigh diagram is not available in mean stress ranges,
HyperLife extrapolates
the Haigh diagram.Figure 7. Conversion of Multi-Mean Curve to Haigh
Diagram
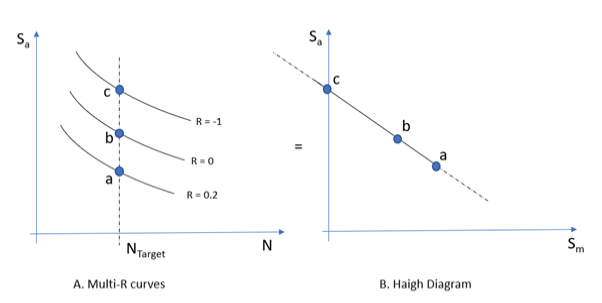
Safety Factor with Multi-Ratio
To calculate safety factor, HyperLife create an internal
Haigh diagram for the target life using multi-mean SN
curve by finding stress amplitude-mean stress pairs at
the target life. The number of data points of the Haigh
diagram is the number of curves. Thus, the more number
of curves, the better result. When Haigh diagram is not
available in mean stress ranges, HyperLife extrapolates the Haigh
diagram.Figure 8. Conversion of Multi-Mean Curve to Haigh
Diagram
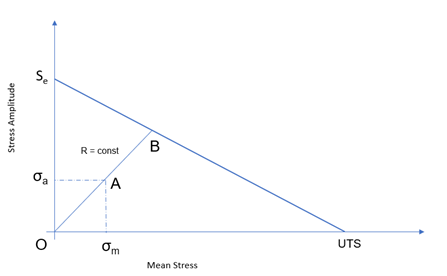
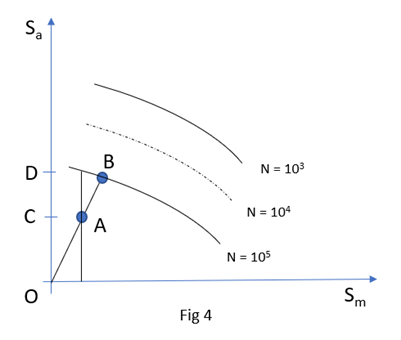
Safety Factor with Haigh
Safety factor (SF) is calculated in the following manner
in Figure 9.Figure 9. When target life is 100000:
Constant R : SF = OB/OA
Constant mean : SF = OD/OC
If Haigh diagram for a target life is not defined,
HyperLife creates Haigh
diagram for the target life. In Figure 9, if target life is 10000, and Haigh
diagram for N=10000 is not defined, HyperLife will created dashed
curve to calculate Safety factor.