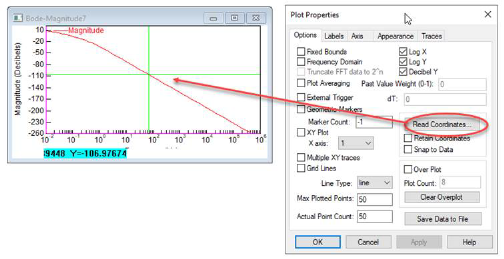
You can activate a status bar and crosshairs in Bode plots to track and display data along the
frequency (x) and phase/magnitude (y) axes. To do so, click Read Coordinates in the plot Properties dialog box.