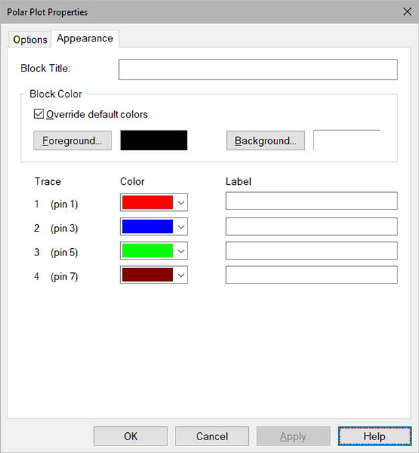
Background: Specifies the plotting area color.
Foreground: Specifies the axis labels and scaling text color.
Override Default Colors: Overrides the color specified in View > Colors.
Block Title: Provides a name for your polar plot that appears in the title bar. Titles can be up to 80 alphanumeric characters. By default, polar plots are titled Polar Plot.
Trace / Color / Label: Specifies a color and label for the input connector and corresponding signal trace in the polar plot.
Curve plot

Compass polar plot

Curve and compass polar plot
