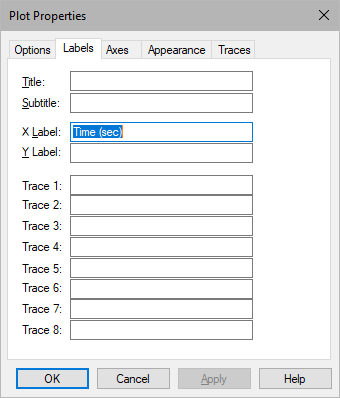
Title and Subtitle: Provide names for your plots. Titles and subtitles can be up to 80 alphanumeric characters. The title appears in the plot title bar; the subtitle is displayed in the top area of the plot. By default, plots are titled Plot and have no subtitles.
Trace 1, Trace 2, …: Specifies labels for up to eight input signals. Trace 1 corresponds to the top input connector, Trace 2 corresponds to the next lower connector, and so on. Signal labels can contain up to 80 alphanumeric characters.
X Label and Y Label: X Label specifies a label for the x-axis. Y Label specifies a label for the y-axis. Axis labels can contain up to 80 alphanumeric characters.
To label the x-axis on an XY plot, Embed automatically labels the x-axis with the label for the input signal used for x coordinate generation. For example, if you activate XY Plot and choose 2 under X Axis, Embed uses the label assigned to input signal 2.
For plots with multiple subplots, you can create y-axis labels for each subplot by separating them with a semi-colon (;). Insert a blank space for unlabeled subplots.