
Usage Trends
The Usage Trends page provides the ability to report on one or more features over a specified time frame while breaking the time frame into smaller segments, each with their own average and peak usage statistics.
For example, a report spanning a quarter can be broken down to also show the individual numbers of each month or each week. The report can also be pivoted, similar to the checkout statistics report, to show the usage per user, host, project, or custom group basis as well.
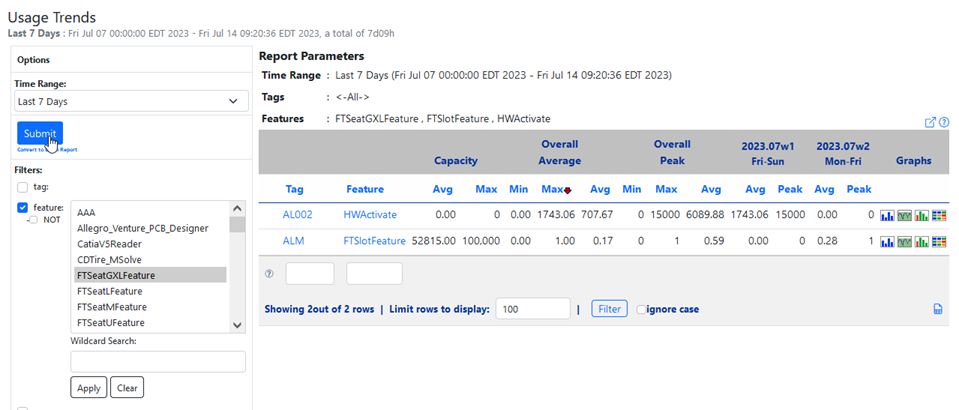
In this example, the table shows weekly usage, but it can also be set to hourly, weekly, monthly, semi-monthly and quarterly time frames. The advantage of this table is that you can see specifics on usage. In this case, the average and capacity in alignment, so no changes are necessary.
- Quarterly
- Monthly
- Semi-monthly (first segment includes month days 1-15 and all remaining month days are placed into the second segment)
- Biweekly (if report interval is for a month, the first segment will begin on the first day of the month)
- Weekly (if report interval is for a month, the first segment will begin on the first day of the month)
- Daily
- Hourly
- Tag
- The tag representing the license server.
- Feature
- The license feature name.
- Capacity Avg
- The average capacity.
- Capacity Max
- The maximum capacity.
- Overall Average Min
- The overall minimum average feature usage.
- Overall Average Max
- The overall maximum average feature usage.
- Overall Average Avg
- The overall average feature usage.
- Overall Peak Min
- The peak minimum average feature usage.
- Overall Peak Max
- The peak maximum average feature usage.
- Overall Peak Avg
- The peak overall average feature usage.
Options are also provided to hide certain types of statistics from the report as well as whether to include reservation checkouts.