Spread Graph
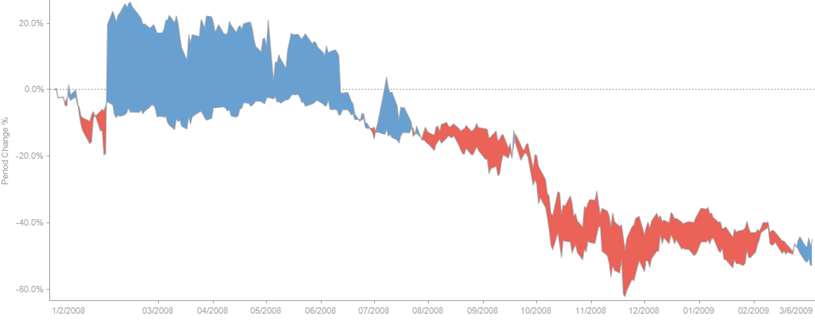
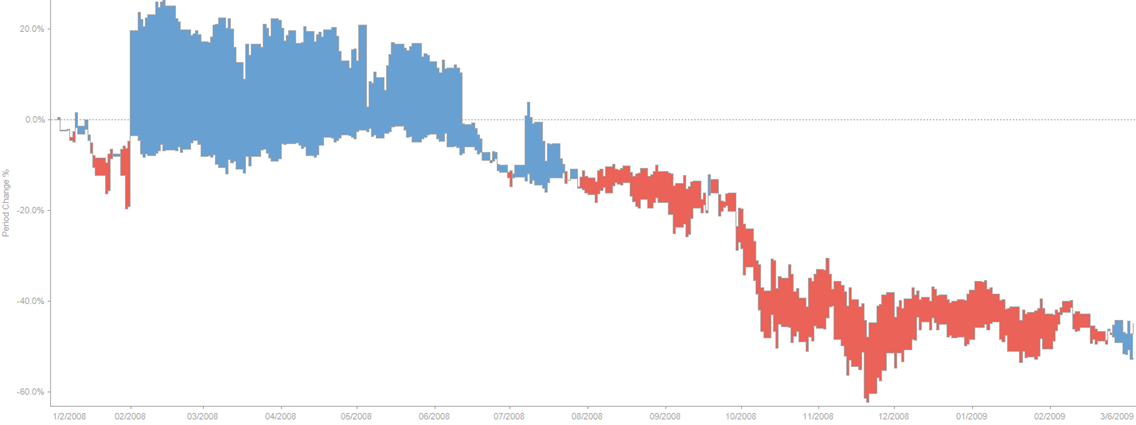
The Spread Graph displays the variance or spread between two time-based data series.
Typical use cases include comparing a stock’s price performance to an Index or a bond’s yield to a benchmark rate.

Figure 3-25. A spread graph with linear interpolation.

Figure 3-26. A spread graph with stepped interpolation.


