


|
Count Distinct Percent of Parent and Count Distinct Percent of Total
Count Distinct Percent of Parent is the Count Distinct expressed as a percentage share of the Count Distinct as the parent node level. While Count Distinct Percent of Total is the Count Distinct expressed as a percentage share of the Count Distinct in the total data table.
Sample dataset:
|
Auto Key |
Row Count |
CustomerID |
Product Downloaded |
Product Family |
Product Vendor |
Timestamp |
|
1 |
1 |
c1 |
Prod X |
Fam A |
Boogle |
03/04/2022 |
|
2 |
1 |
c1 |
Prod Y |
Fam A |
Boogle |
02/04/2022 |
|
3 |
1 |
c1 |
Prod Z |
Fam B |
Boogle |
29/04/2022 |
|
4 |
1 |
c2 |
Prod X |
Fam A |
Boogle |
04/04/2022 |
|
5 |
1 |
c2 |
Prod Y |
Fam A |
Boogle |
04/04/2022 |
|
6 |
1 |
c2 |
Prod Z |
Fam B |
Boogle |
18/04/2022 |
|
7 |
1 |
c3 |
Prod X |
Fam A |
Boogle |
10/04/2022 |
|
8 |
1 |
c3 |
Prod Y |
Fam A |
Boogle |
11/04/2022 |
|
9 |
1 |
c3 |
Prod Z |
Fam B |
Boogle |
01/04/2022 |
|
10 |
1 |
c4 |
Prod Z |
Fam B |
Boogle |
01/04/2022 |
|
11 |
1 |
c91 |
Prod X |
Fam A |
Boogle |
15/03/2022 |
|
12 |
1 |
c91 |
Prod X |
Fam A |
Boogle |
15/04/2022 |
|
13 |
1 |
c91 |
Prod X |
Fam A |
Boogle |
15/05/2022s |
|
14 |
1 |
c91 |
Prod X |
Fam A |
Boogle |
15/06/2022 |
|
15 |
1 |
c91 |
Prod X |
Fam A |
Boogle |
16/06/2022 |
|
16 |
1 |
c92 |
Prod Y |
Fam A |
Boogle |
01/05/2022 |
|
17 |
1 |
c92 |
Prod Z |
Fam B |
Boogle |
01/05/2022 |
|
18 |
1 |
c92 |
Prod Y |
Fam A |
Boogle |
06/05/2022 |
|
19 |
1 |
c92 |
Prod Z |
Fam B |
Boogle |
03/06/2022 |
|
20 |
1 |
c92 |
Prod Z |
Fam B |
Boogle |
06/06/2022 |
This dataset contains information about software product downloads.
|
Count |
Details |
|
1 |
Product vendor |
|
2 |
Product families |
|
3 |
Products |
|
6 |
Customers |
|
3 |
Month and Year time periods |
|
20 |
Unique download occasions |
Below is the defined breakdown in a Table visualization:

The added columns have the following aggregations:
|
Column |
Aggregate |
|
Row Count |
Sum |
|
CustomerID |
Count Distinct |
|
CustomerID |
Count Distinct Percent of Parent |
|
Customer ID |
Count Distinct Percent of Total |
By counting the rows in the dataset, we can count how many different download occasions we have.
By doing Count Distinct on CustomerID, we find out how many unique customers there are, regardless of how many times each customer did a download.
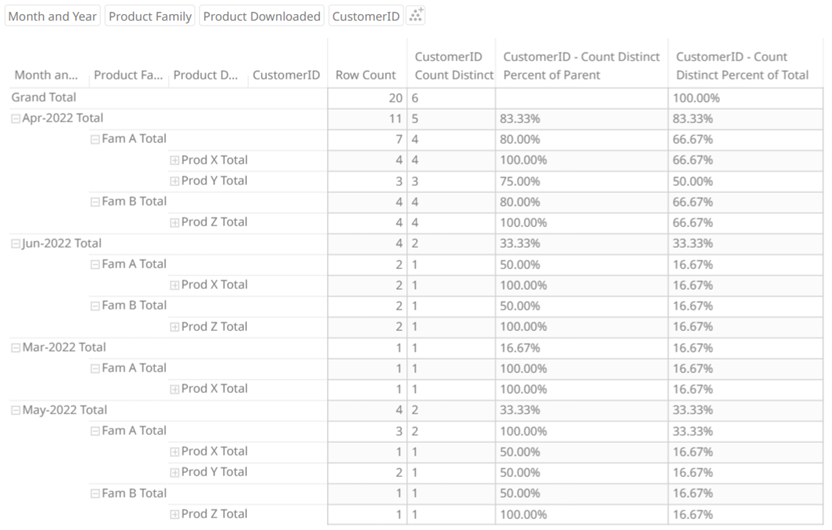
For Count Distinct Percent of Parent, we can determine how large was the portion that was downloaded by all Customers during May 2022. Based on the visualization, it’s 33% (one-third, 2 out of 6).
For Count Distinct Percent of Total, we can determine the portion of Product Z that was downloaded by all Customers in April 2022. Based on the visualization, it’s 67% (two-thirds, 4 out of 6).