


|
Adding a Color Legend
The Color Legend displays the color variables of the associated visualization. You can also set the orientation and style or enable the ability to do a filter or to display this part in the PDF output.
Steps:
1. After double-clicking or drawing a rectangle
on the dashboard canvas, click  on
the Select Part pane then click the Color Legend
on
the Select Part pane then click the Color Legend
 icon.
icon.
The Color Legend Settings pane is displayed, and the Color Legend part is added on the dashboard canvas.
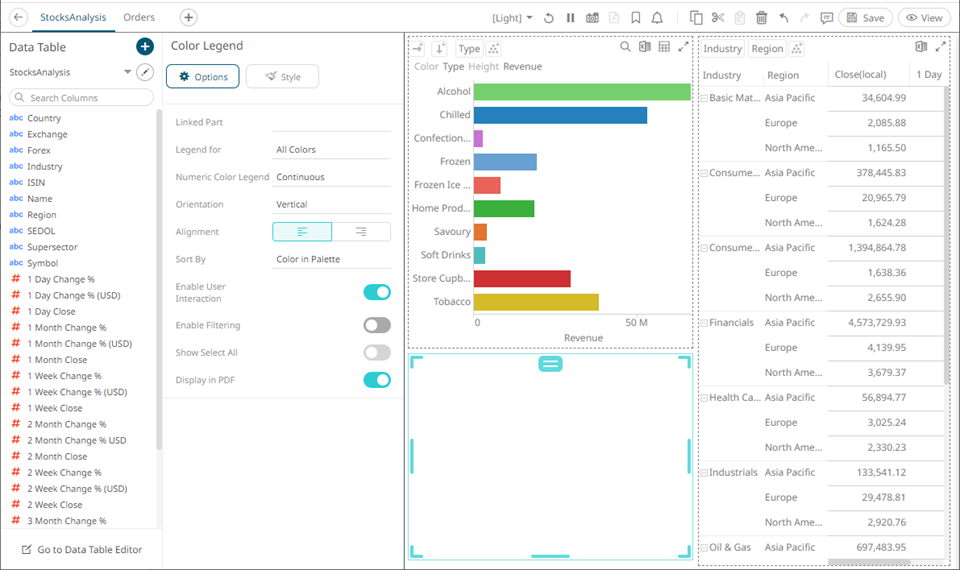
2. Select any of the available parent visualizations with color variable from the Linked Part drop-down list.
The color legend is connected to its parent visualization and the link between them is displayed. The color variables are retrieved from this visualization and displayed in the legend.
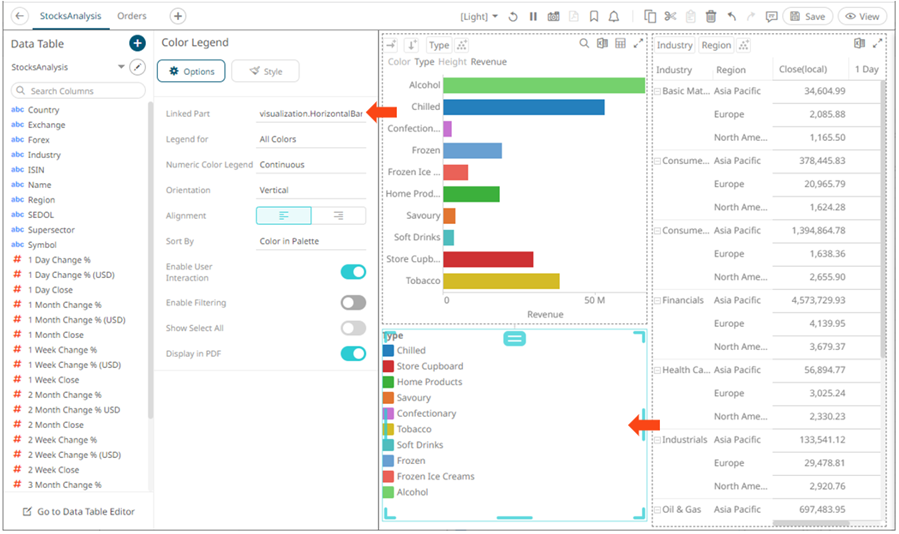
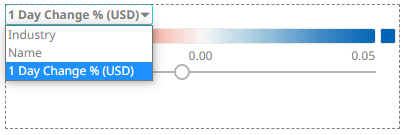
If the visualization can display multiple color variables, which is the case with the Table and Time Combination, then the legend displays a drop list of possible variables to display.
There are two Color Legend styles:
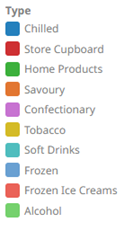
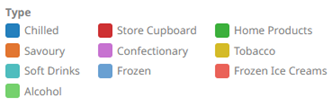
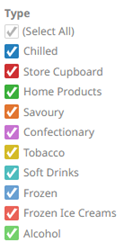
· Categorical
The categorical style color legend lists all text categories and colors used in the associated visualization for the selected source column.
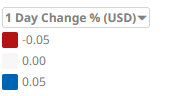
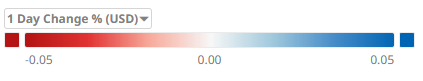
· Numeric
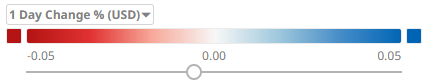
The numeric style color legend displays the color range used within the associated visualization for the selected numeric source column.
The style displayed depends on the active color variable of the linked visualization.
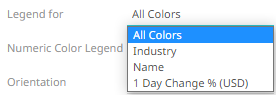
3. Set the color legend to All Colors or to a specific source column.
4. The style of a Numeric Color Legend can be fixed either:
· Continuous
· Discrete
5. For text color legends, you can select the following:
· Orientation
¨ Vertical
¨ Horizontal
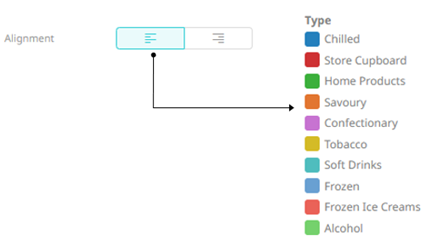
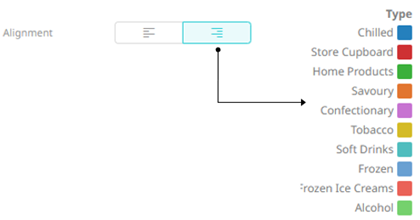
· Alignment
The following examples are for Vertical orientation.
¨ Left
¨ Right
6. Tap the Enable User Interaction slider to turn it on and display the numeric color range slider.

Otherwise, the color legend is read-only, and the slider is hidden:
7. For text color legends (Categorical), you can enable filtering and allow selection of all items (Show Select All):

8. Tap the Display in PDF slider to turn it on and include this dashboard part in the PDF output.
9. To set the style of the Color Legend,
click Style  .
.
The page updates to display the Style pane.
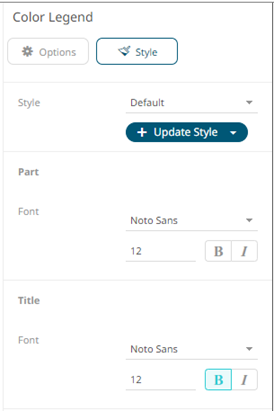
2. Set the Font type, size, style (Bold and/or Italic).
For the part title, the font is set to Bold by default.
3. Click Update Style  and select any of the following
options:
and select any of the following
options:
· Set current as default – Save the changes and set it as the default.
· Create custom style – Save the changes and set it as a custom style.
The Style pane updates to display the Title control.
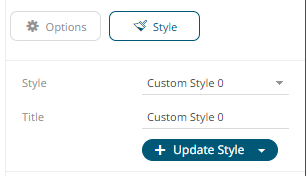
¨ Enter the custom style Title.
¨ If there are additional changes made, click Update Current Style in the Update Style drop-down.
The new custom style is added in the Workbook > Theme > Custom Styles list.
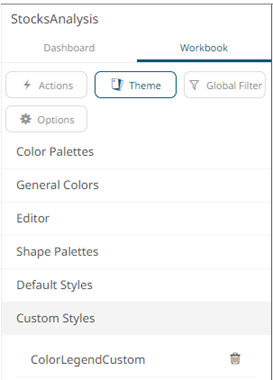
If published, the custom style configuration of the Color Legend will be added to the Global custom styles list and can be applied to other parts.
· Reset to default – Revert to the original default settings.
9. Click the Save  icon on the toolbar to save the
changes.
icon on the toolbar to save the
changes.
When
saved, the  notification
is displayed.
notification
is displayed.