Numeric Stacked Needles Graph Settings
Numeric Stacked Needles again display price distributions.
Unlike the standard Numeric Needle Graph, multiple items can be identified at a single price.
A common usage is displaying client activity within an order book.
The numeric
stacked needle graph settings pane is displayed after clicking the
Options  button.

|
Setting |
Description |
|
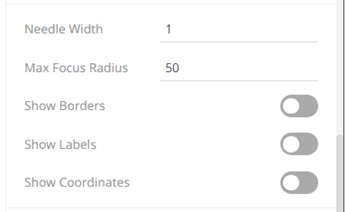
Needle Width |
Specifies the width in pixels of each needle: NOTE: This is overridden when a column is added in the Size variable. Consequently, the width of the needles will be based on the comparison of their size in relation to where they are located on the X axis. |
|
Max Focus Radius |
Determines the maximum radius of the focus circle when hovering on the needles. This also controls the padding of the axis in the direction in which the needles expand, allowing the focus circle to have enough space to be drawn. |
|
Show Borders |
Specifies whether a border is drawn around needles. These are only visible if the Needle Width is greater than 1 pixel. |
|
Show Labels |
Specifies whether node labels will be displayed. |
|
Show Coordinates |
Determines whether the graph coordinates (i.e., X-Y plots, or Date/Time-Y plots) on mouse over are displayed in the visualization. |
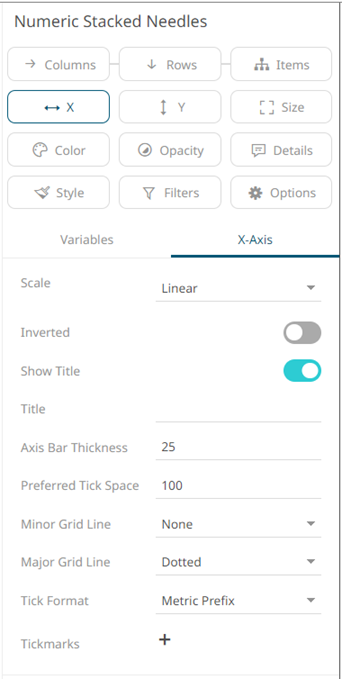
Other visualization-specific properties can be set by clicking on the X-Axis variable drop area and then selecting the X-Axis tab:

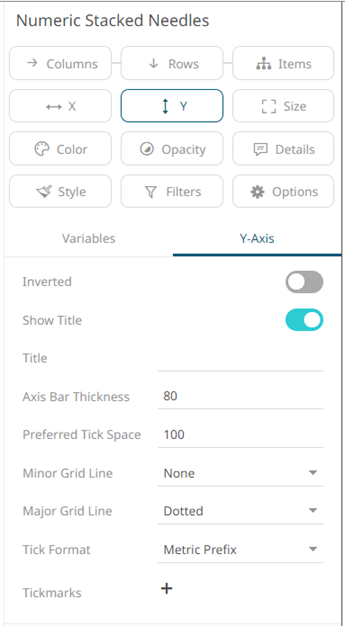
Or also, by clicking on the Y-Axis variable drop area and then selecting the Y-Axis tab:


