Shapes/Choropleth
The Shapes visualization can be used to display data where both physical location and size are important.
They clearly show data correlations and clustering that is geospatial in nature.
Unlike the Geographic Scatter Plot, the size of each shape is fixed, imparting the importance of the item. As a consequence, data should be relative to each shape size, such as area densities.
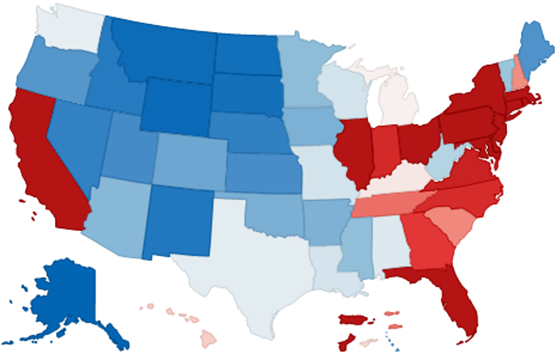
Figure 4-54. A shape visualization.
(c) 2023 Altair Engineering Inc. All Rights Reserved.