Scatter Plot
Each scatter point is represented by:
- X Position
- Y Position
- Size
- Color (numeric or categorical)
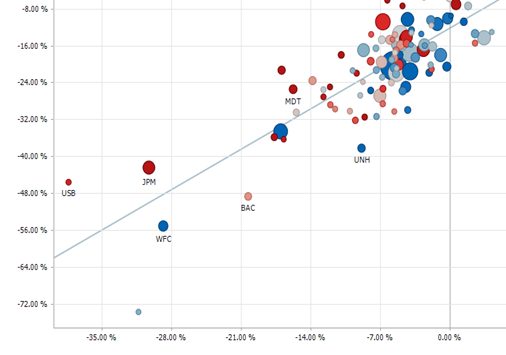
Figure 4-49. A scatter plot with line of best fit.
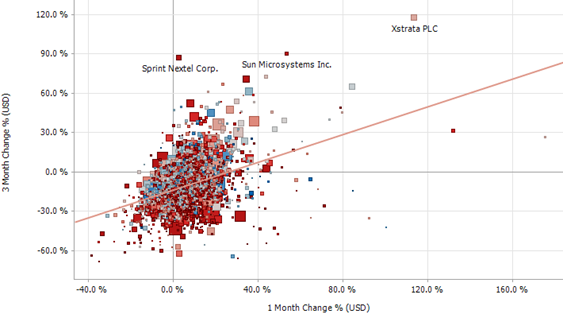
Figure 4-50. A scatte plot with square scatter points.
(c) 2023 Altair Engineering Inc. All Rights Reserved.