Order Book Graph
- Price (as Height)
- Tick Size (as Size)
- Order Size (as Color)
- Duration of Aggregated Orders at a given price (time period)
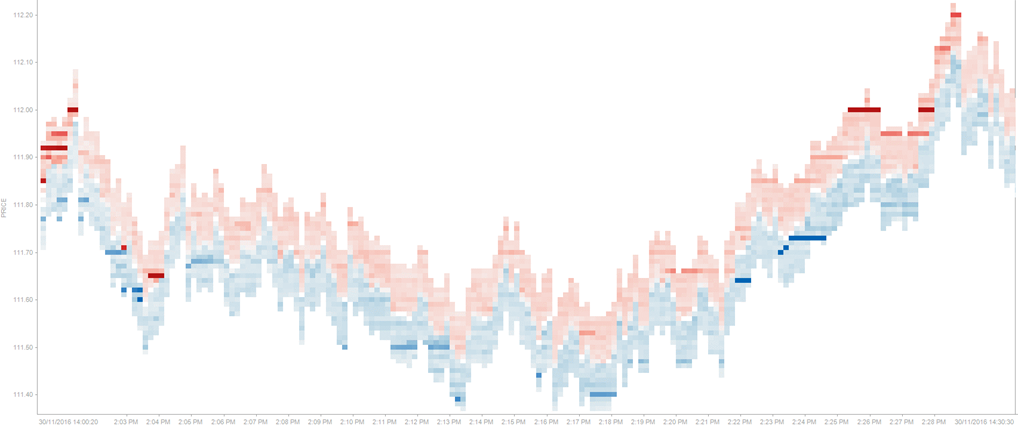
Figure 3-20. An order book graph displaying the top 10 levels of an orderbook across time.
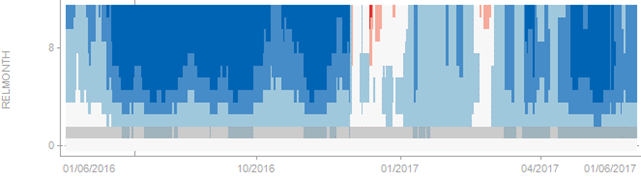
Figure 3-21. An order book graph displaying a forward curve across time.
(c) 2023 Altair Engineering Inc. All Rights Reserved.