Needle Graph
They work especially well when combined with a Line Graph.
The most common use of a Needle Graph is when showing the trading volume for a stock, typically underneath the price performance.
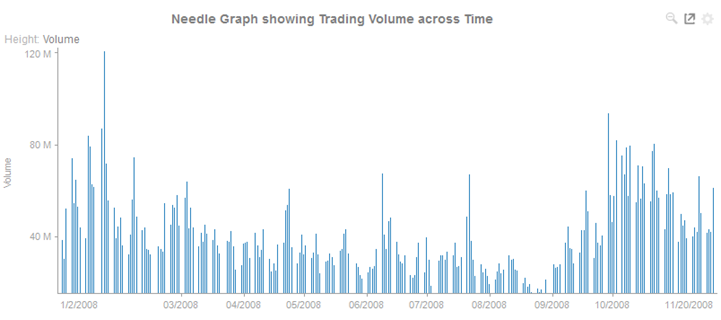
Figure 3-15. A needle graph.
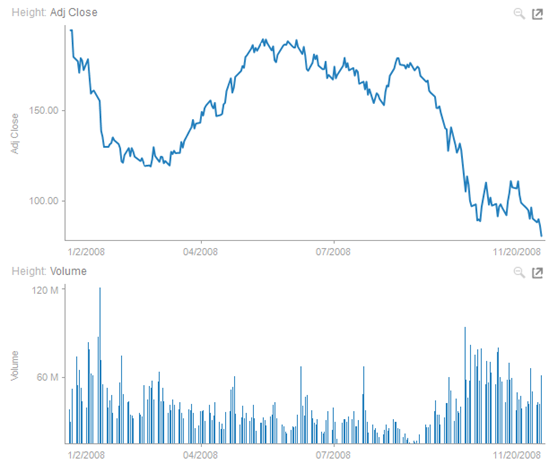
Figure 3-16.A needle graph in combination with a line graph.
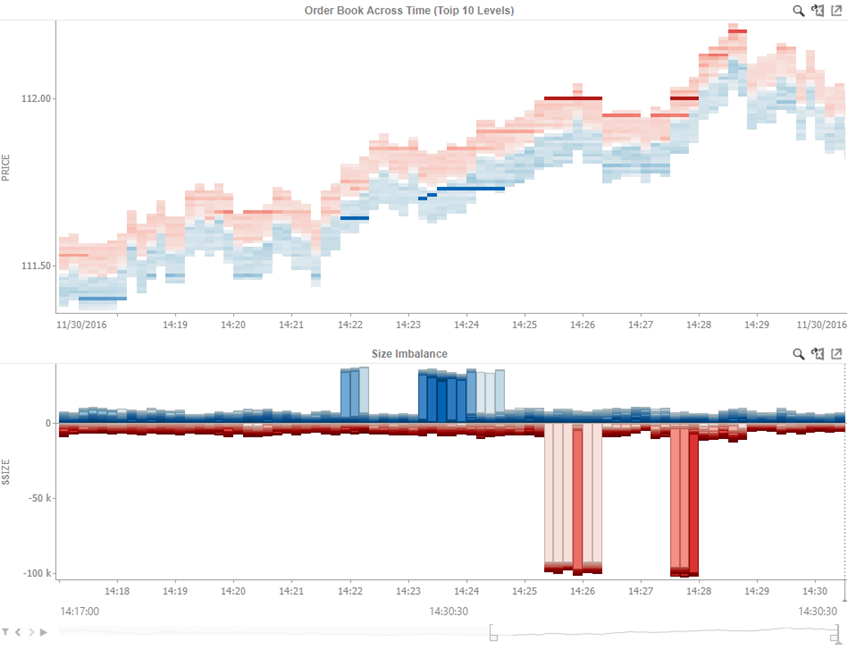
Figure 3-17. A needle graph with full width needles in a combination with an Order Book graph.
(c) 2023 Altair Engineering Inc. All Rights Reserved.