Funnel Chart
This type of chart can be useful in identifying potential problems in an organization's sales process.
Color can be used to represent either a Stage in the process, or the change in performance for that stage against a prior period.
Alternatives to the Funnel Chart would be a simple Bar Graph, or a Stacked Bar Graph.
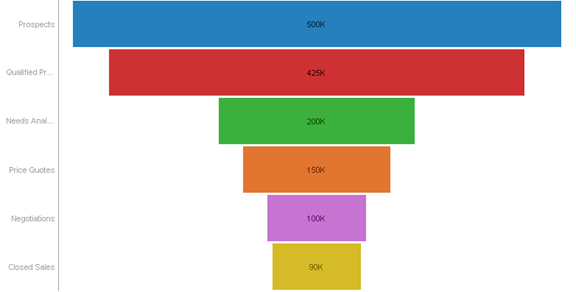
Figure 4-25. Funnel Chart with Color showing Stage in the Funnel.
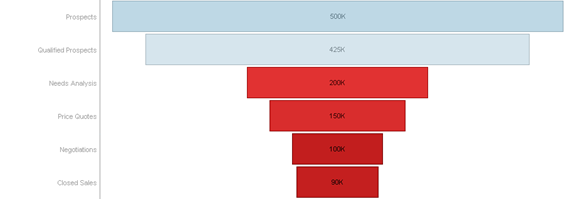
Figure 4-26. Funnel Chart with Color showing Change in Performance.
(c) 2023 Altair Engineering Inc. All Rights Reserved.