Cross Tab Pivot Table
Pivot Tables support a single numeric value being represented at the cross point of hierarchical rows and columns.
Each intersection cell can display the aggregated numeric value and its associated color range, which can be subdued or intense. Numeric labels can also be removed to produce a Heat Matrix.
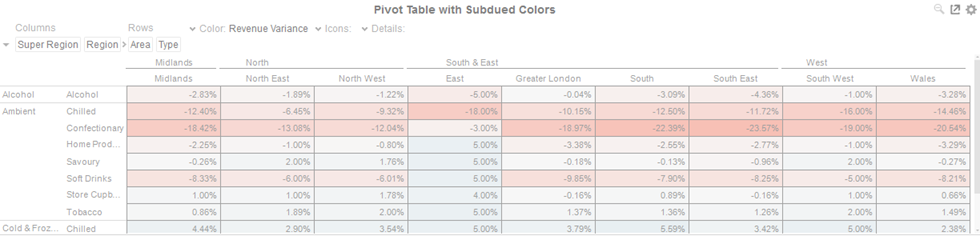
Figure 4-14. A pivot table with subdued colors.
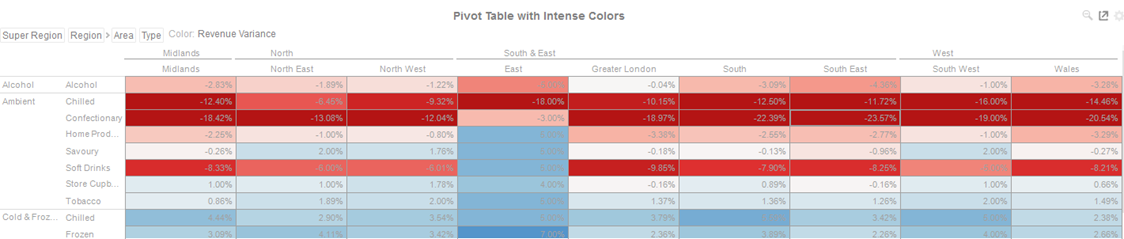
Figure 4-15. A pivot table with intense colors.
(c) 2023 Altair Engineering Inc. All Rights Reserved.