Box Plot
The plot draws the Minimum, 25th Percentile, Median, 75th Percentile, and Maximum of the specified measure by category.
This can be provided as a single measure, where Panopticon performs the aggregation.
Or as separate measures for each component of the box plot, where the data source performs the aggregation.
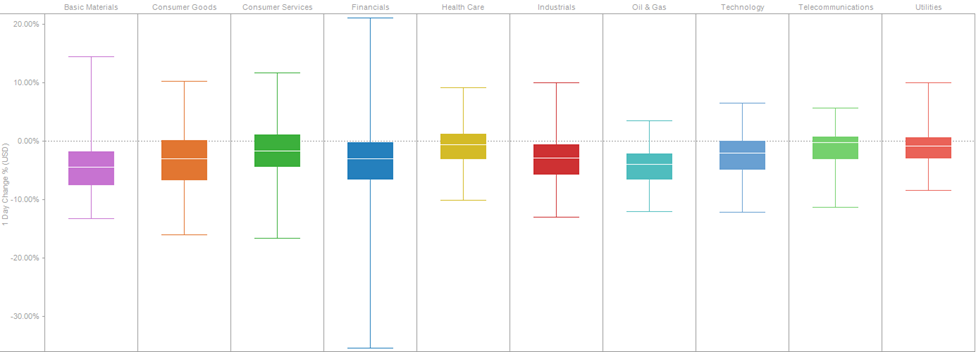
Figure 4-6. A Box Plot of Price Performance Distributions by Industry.
(c) 2023 Altair Engineering Inc. All Rights Reserved.