


|
Visualization Filtering
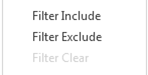
Visualizations themselves can be used as filters by selecting items, and right-clicking to display the context menu with these three options:
-
Filter Include - Filters the dashboard to include selected items
-
Filter Exclude - Filters the dashboard to exclude the selected items
-
Filter Clear - Removes any visualization filters
NOTES: In the Web client, the Filter Include and Filter Exclude options are disabled when there is no breakdown or the root is selected in visualizations.
When a visualization
filter has been applied, a Filter icon appears to the right of the visualization
title: 
Clicking on this Filter icon will remove the visualization filter.
Additionally, a Filter icon appears at the top right of the dashboard:
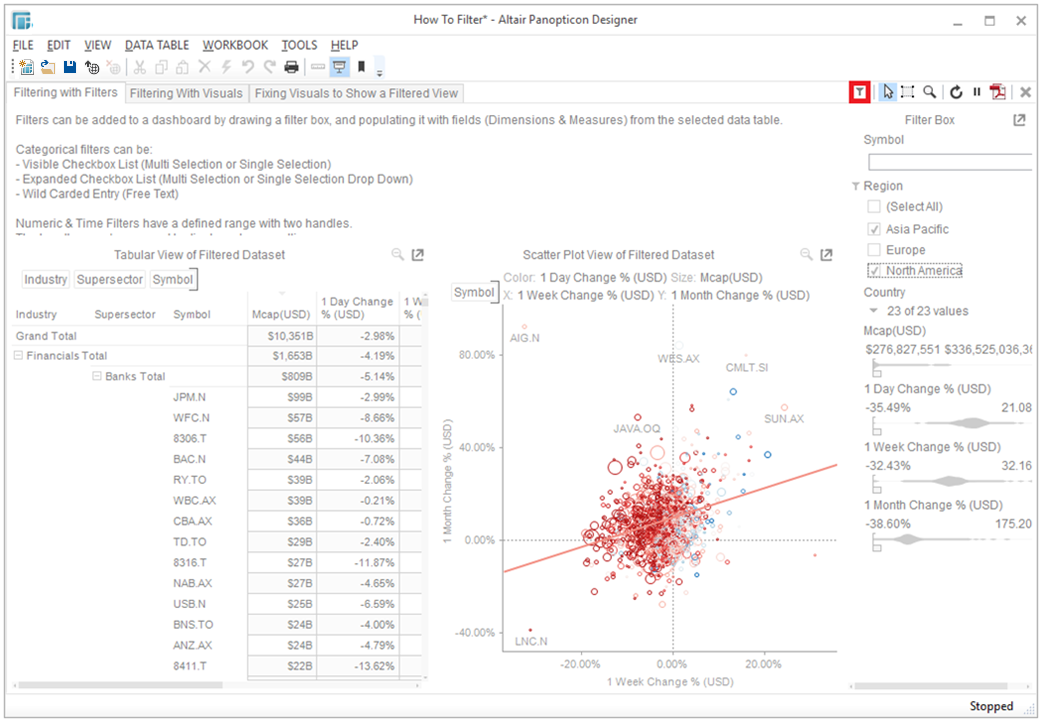
For the example Multiple Selection filter above:
Region = Asia Pacific and North America are selected and Europe is unselected
Clicking on this icon will remove all filters, from both the visual and filter controls.
